Note
Go to the end to download the full example code or to run this example in your browser via Binder
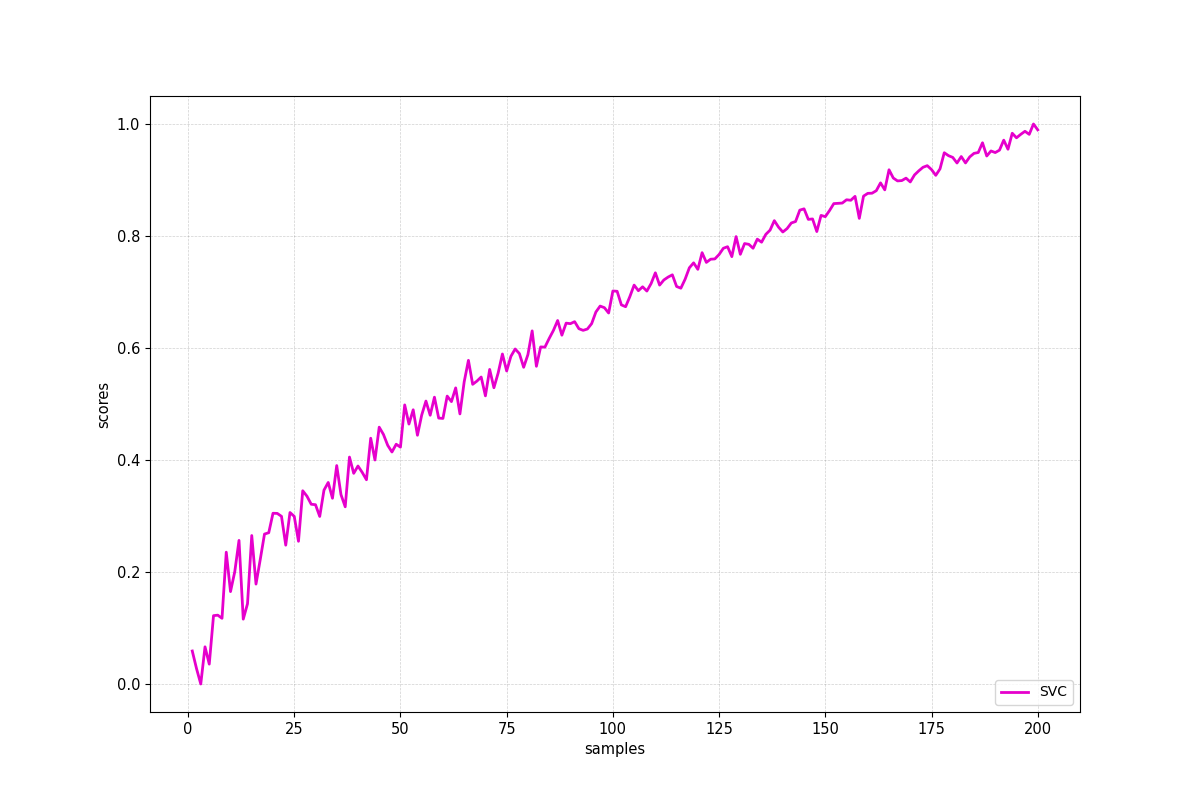
Plot model scores#
visualizes model fined tuned scores from the cross validation
# Author: L.Kouadio
# Licence: BSD-3-clause
plot_model_scores() is able to
read multiple classifiers and accepts differents way of estimators arrangements.
Here is two examples of estimators arrangement before feeding to the function.
Append scores to the model
import numpy as np
from watex.exlib.sklearn import SVC
from watex.view.mlplot import plot_model_scores
svc_model = SVC()
svc_fake_scores = np.sqrt (np.abs (np.linspace (0, 50, 200 ) + np.random.randn (200 ))) #add gaussian noises
# normalize the scores
svc_fake_scores = (svc_fake_scores - svc_fake_scores.min())/ (svc_fake_scores.max() - svc_fake_scores.min())
plot_model_scores([(svc_model, svc_fake_scores )], ** dict (xlabel ='samples', ylabel ='scores', font_size =7., lw=2. ))
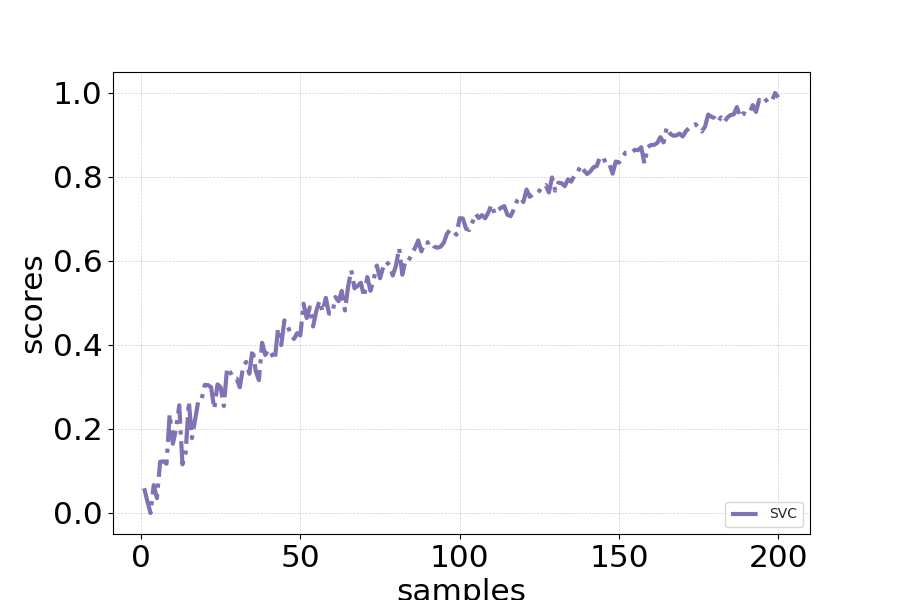
Use scores separately and customize plot by passing baseplot keyword properties
base_plot_params ={
                    'lw' :3.,
                    'ls': '-.',
                    'lc':'m',
                    'ms':7.,
                    'fig_size':(9, 6),
                    'font_size':15.,
                    'xlabel': 'samples',
                    'ylabel':'scores' ,
                    'marker':'o',
                    'alpha' :1.,
                    'yp_markeredgewidth':2.,
                    'show_grid' :True,
                    'galpha' :0.2,
                    'glw':.5,
                    'rotate_xlabel' :90.,
                    'fs' :3.,
                    's' :20 ,
                    'sns_style': 'ticks',
                }
plot_model_scores([svc_model], scores =[svc_fake_scores] , **base_plot_params )
Total running time of the script: (0 minutes 0.341 seconds)