Note
Go to the end to download the full example code or to run this example in your browser via Binder
Plot errors vs epochs#
visualizes the cost(errors ) against the number of epochs of two different learning rates.
# Author: L.Kouadio
# Licence: BSD-3-clause
from watex.datasets import load_iris
from watex.base import AdalineGradientDescent
from watex.utils.plotutils import plot_cost_vs_epochs
X, y = load_iris (return_X_y= True )
ada1 = AdalineGradientDescent (n_iter= 10 , eta= .01 ).fit(X, y)
ada2 = AdalineGradientDescent (n_iter=10 , eta =.0001 ).fit(X, y)
plot_cost_vs_epochs (regs = [ada1, ada2] )
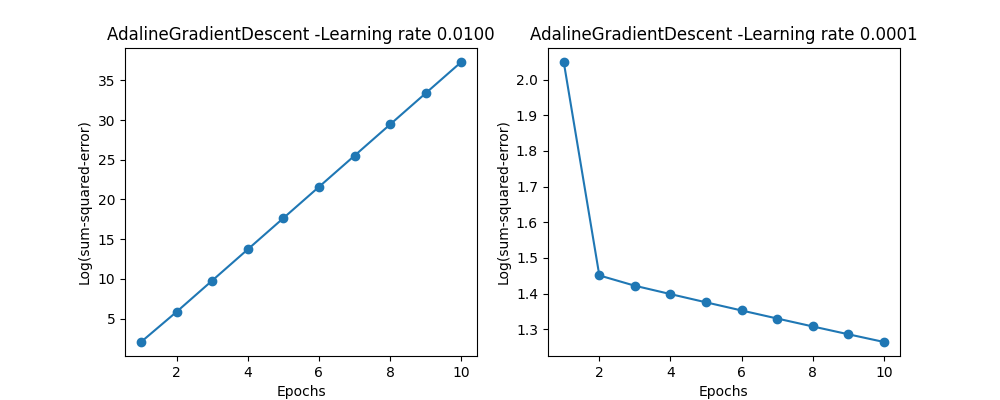
array([<AxesSubplot:title={'center':'AdalineGradientDescent -Learning rate 0.0100'}, xlabel='Epochs', ylabel='Log(sum-squared-error)'>,
       <AxesSubplot:title={'center':'AdalineGradientDescent -Learning rate 0.0001'}, xlabel='Epochs', ylabel='Log(sum-squared-error)'>],
      dtype=object)
Total running time of the script: (0 minutes 0.193 seconds)