Note
Go to the end to download the full example code or to run this example in your browser via Binder
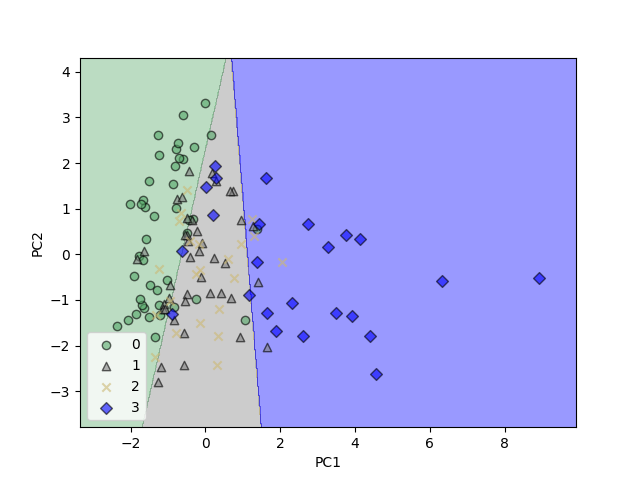
Plot decision regions#
displays the decision region for the training data reduced to two principal component axes.
# Author: L.Kouadio
# Licence: BSD-3-clause
Fetch the test data and do select the numerical features and impute the missing values
from watex.datasets import fetch_data
from watex.exlib.sklearn import SimpleImputer, LogisticRegression
from watex.analysis.decomposition import decision_region
from watex.utils import selectfeatures
data= fetch_data("bagoue original").get('data=dfy1') # encoded flow categories
y = data.flow ; X= data.drop(columns='flow')
# select the numerical features
X =selectfeatures(X, include ='number')
# imputed the missing data
X = SimpleImputer().fit_transform(X)
lr_clf = LogisticRegression(multi_class ='ovr', random_state =1, solver ='lbfgs')
_=decision_region(X, y, clf=lr_clf, split = True, view ='Xt') # test set view
/home/docs/checkouts/readthedocs.org/user_builds/watex/checkouts/v0.3.3/watex/analysis/decomposition.py:256: UserWarning:

You passed a edgecolor/edgecolors ('black') for an unfilled marker ('x').  Matplotlib is ignoring the edgecolor in favor of the facecolor.  This behavior may change in the future.
Total running time of the script: (0 minutes 0.284 seconds)