Note
Go to the end to download the full example code. or to run this example in your browser via Binder
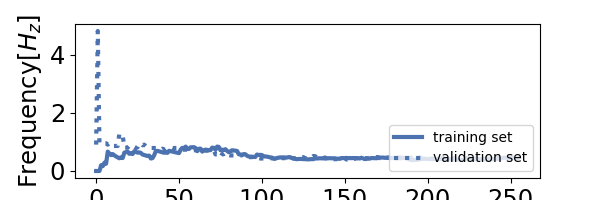
Plot Regression learning scoring#
visualizes the regressor learning curves with (root)mean squared error scorings.
# Author: L.Kouadio
# Licence: BSD-3-clausee
from watex.datasets import fetch_data
from watex.view.mlplot import plot_reg_scoring
# Note that for the demo, we import SVC rather than LinearSVR since the
# problem of Bagoue dataset is a classification rather than regression.
# if use regression instead, a convergence problem will occurs.
from watex.exlib.sklearn import SVC
X, y = fetch_data('bagoue analysed')# got the preprocessed and imputed data
svm =SVC()
baseplot_kws = {'lc': 'b',
                'lw': 3,
                "font_size": 7 }
t_errors, v_errors =plot_reg_scoring(svm, X, y, return_errors=True,
                                     **baseplot_kws)
Total running time of the script: (0 minutes 1.491 seconds)