Note
Go to the end to download the full example code. or to run this example in your browser via Binder
Plot pairwise features#
creates a pairwise comparison between features.
# Author: L.Kouadio
# Licence: BSD-3-clause
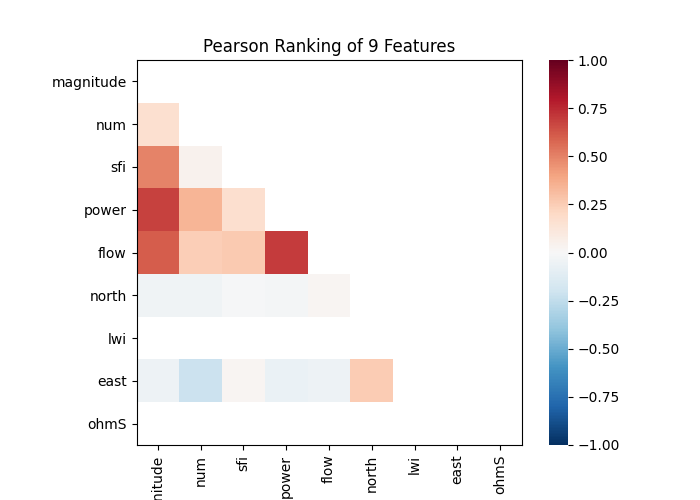
Plot the numerical pairwise correlation It shows [‘pearson’|’spearman’|’covariance’] correlation.
from watex.datasets import fetch_data
from watex.view import ExPlot
from watex.utils import bi_selector
data = fetch_data ('bagoue original').get('data=dfy1')
# we can use the biselector for selectng the categorical and numerical
# feature for plotting
num_data, cat_data = bi_selector (data, return_frames= True )
p= ExPlot(tname='flow', fig_size=(7, 5)).fit(num_data)
p.plotpairwisecomparison(fmt='.2f',  pkg ='yb',
                                                             annot=True,
                                                             cmap='RdBu_r',
                                                             vmin=-1,
                                                             vmax=1 )
<'ExPlot':xname=None, yname=None , tname='flow'>
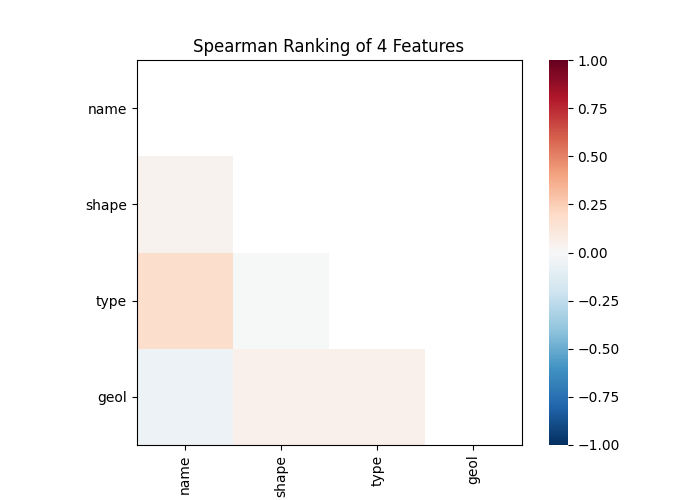
Plot the categorical pairwise correlation For visulizing the categorical features using the spearman rho correlation
p= ExPlot(tname='geol', fig_size=(7, 5)).fit(cat_data)
p.plotpairwisecomparison(fmt='.2f',
                         corr='spearman',
                         pkg ='yb',
                                                             annot=True,
                                                             cmap='RdBu_r',
                                                             vmin=-1,
                                                             vmax=1 )
/home/docs/checkouts/readthedocs.org/user_builds/watex/envs/master/lib/python3.10/site-packages/scipy/stats/_stats_py.py:112: RuntimeWarning:

The input array could not be properly checked for nan values. nan values will be ignored.


<'ExPlot':xname=None, yname=None , tname='geol'>
Total running time of the script: (0 minutes 0.229 seconds)