Note
Go to the end to download the full example code. or to run this example in your browser via Binder
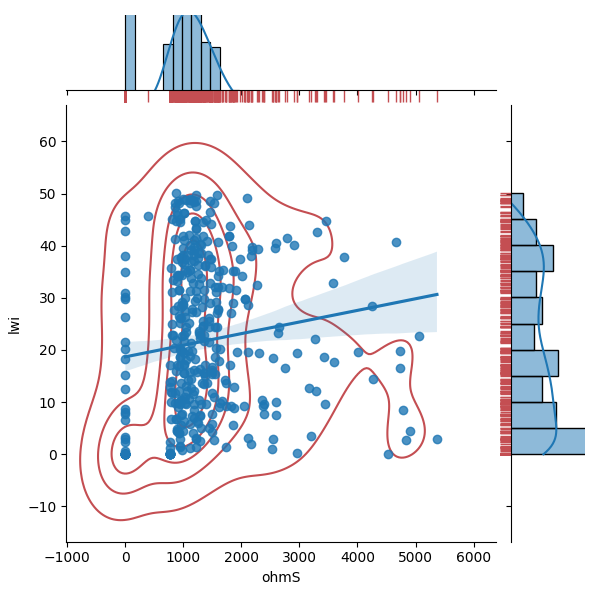
Plot jointing features#
draws a scatter plot with possibility of several semantic features grouping.
# Author: L. Kouadio
# Licence: BSD-3- Clause
from watex.view.plot import QuickPlot
from watex.datasets import load_bagoue
data = load_bagoue ().frame
qkObj = QuickPlot( lc='b', sns_style ='darkgrid',
             fig_title='Quantitative features correlation'
             ).fit(data)
qkObj.fig_size =(7, 5)
sns_pkws={
            'kind':'reg' , #'kde', 'hex'
          # "hue": 'flow',
              }
joinpl_kws={"color": "r",
                    'zorder':0, 'levels':6}
plmarg_kws={'color':"r", 'height':-.15, 'clip_on':False}
qkObj.joint2features(features=['ohmS', 'lwi'],
           join_kws=joinpl_kws, marginals_kws=plmarg_kws,
            **sns_pkws,
          )
QuickPlot(savefig= None, fig_num= 1, fig_size= (7, 5), ... , classes= None, tname= None, mapflow= False)
Total running time of the script: (0 minutes 0.585 seconds)