Note
Go to the end to download the full example code. or to run this example in your browser via Binder
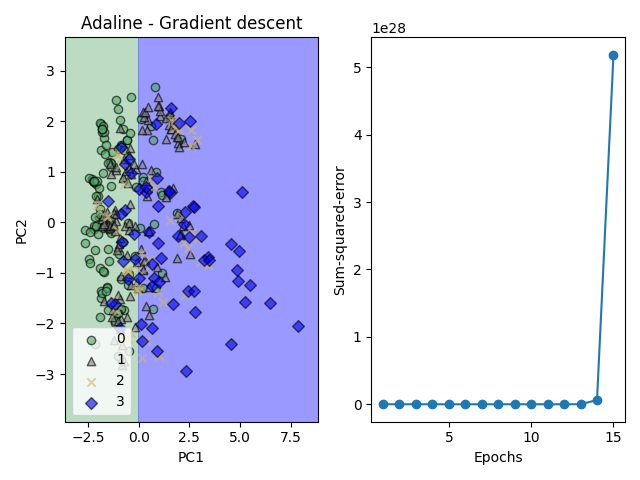
Plot Linear Adaptative Neuron Classifier (Adaline)#
visualizes the Adaline estimator in action for improving the gradient descent through features scaling using the test data
# Author: L.Kouadio
# Licence: BSD-3-clause
Fetch the data
import matplotlib.pyplot as plt
from watex.base import AdalineGradientDescent
from watex.analysis import decision_region
from watex.datasets import fetch_data
X, y = fetch_data ('bagoue prepared data')

fig, axe = plt.subplots (1, 2)
agd= AdalineGradientDescent (n_iter=15, eta=.01).fit(X.toarray(), y )
decision_region(X.toarray(), y, clf=agd, return_axe=True, axe= axe[0]) # test set view
axe[0].set_title ("Adaline - Gradient descent")

axe[1].plot(range (1, len(agd.cost_) +1 ), agd.cost_, marker ="o")
axe[1].set_xlabel ("Epochs")
axe[1].set_ylabel ("Sum-squared-error")
plt.tight_layout()
plt.show()
/home/docs/checkouts/readthedocs.org/user_builds/watex/checkouts/master/watex/analysis/decomposition.py:256: UserWarning:

You passed a edgecolor/edgecolors ('black') for an unfilled marker ('x').  Matplotlib is ignoring the edgecolor in favor of the facecolor.  This behavior may change in the future.
Total running time of the script: (0 minutes 0.195 seconds)