Examples#
This page contains some plotting guides for using watex. It is broken up into base, methods, view, and plot utility sections. For more in-depth guide, visit the full user guide.
Most of the data used for the plot examples are real-world geosciences engineering data. However, the scripts implemented for the visualization work with any kind of dataset.
Applications: Step-by-step guide#
These examples show a step-by-step guide for computing the DC-parameters, the mixture learning strategy to predict the permeability coefficient \(k\)
and restoring tensors via the modules watex.methods and watex.utils.hydroutils. The feature analyses and visualization are performed using the watex.view module.
The datasets explanation can be found in watex.datasets.


Base assessors & estimators#
Examples concerning the watex.base module.

Plot Linear Adaptative Neuron Classifier (Adaline)
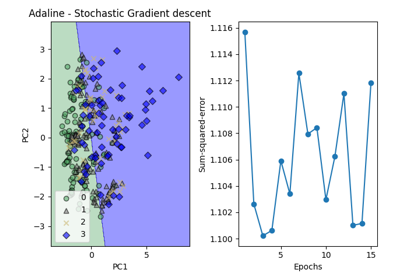
Plot Stochastic Linear Adaptative Neuron Classifier

Analyses#
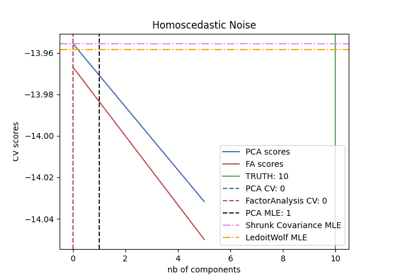
Examples concerning the watex.analysis module.

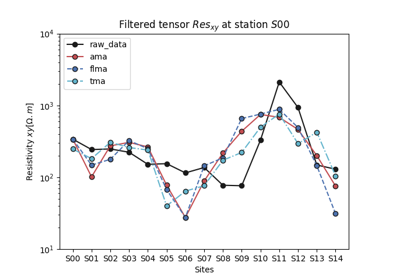
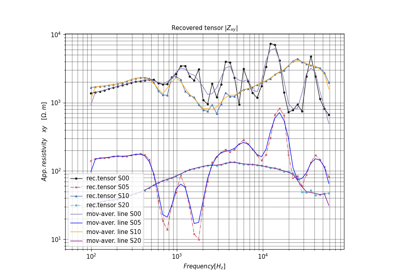
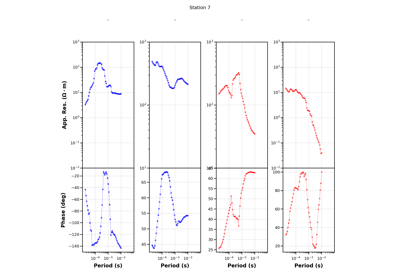
Methods#
Examples concerning the watex.methods module.


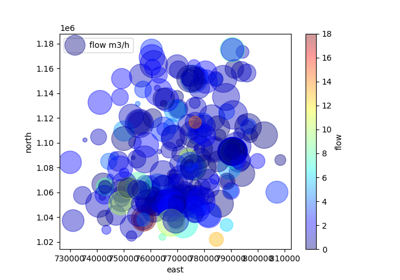
Plot utilities#
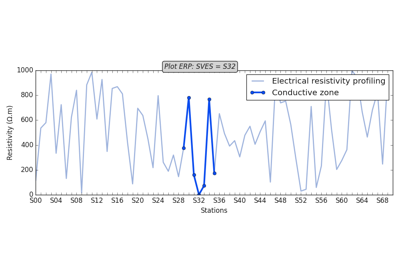
Examples concerning the watex.utils.plotutils module.


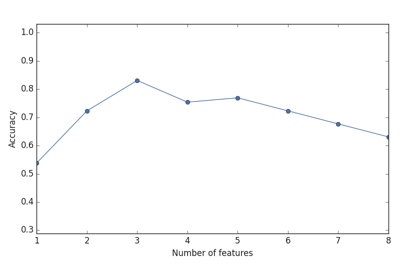


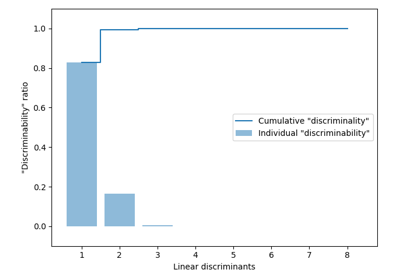
Plot principal components analysis (PCA) components


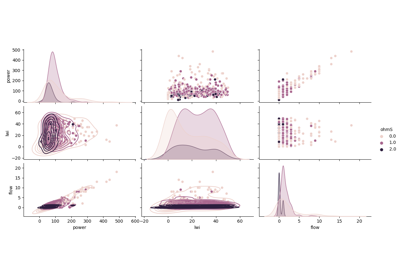
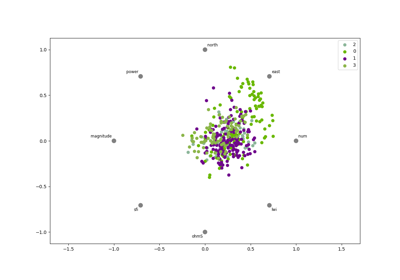
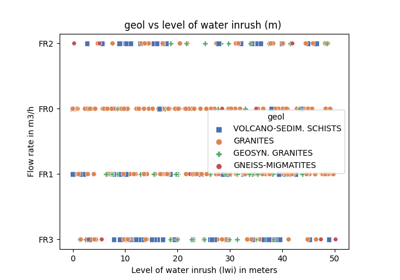
Visualizations#
Examples concerning the watex.view module.


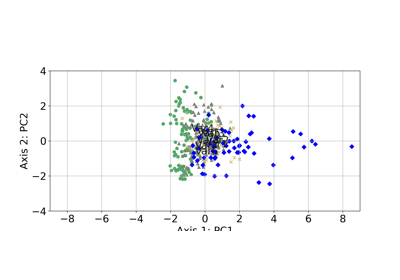
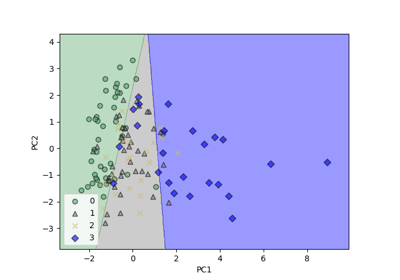
Plot bipolar with Principal component analysis (PCA)