Note
Go to the end to download the full example code or to run this example in your browser via Binder
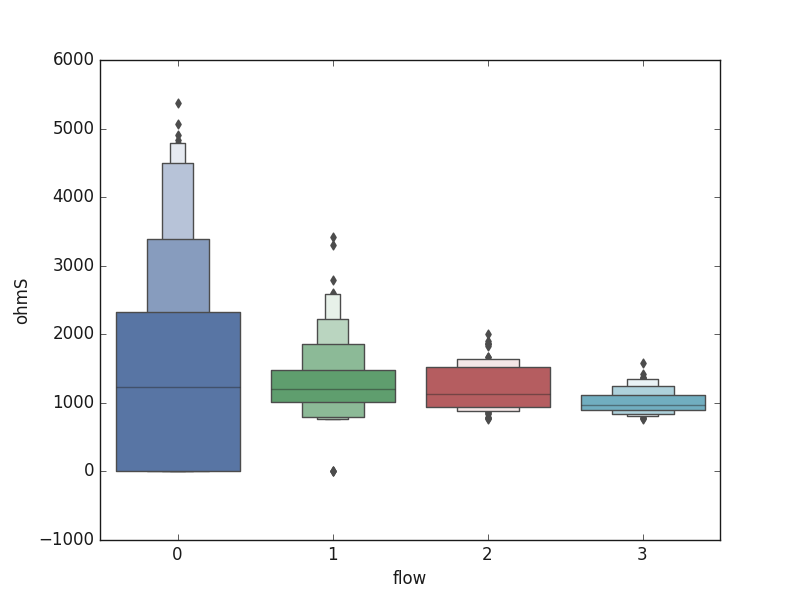
Plot Box#
visualizes the feature distributions using the box, boxen or violin plots
# Author: L.Kouadio
# Licence: BSD-3-clause
import matplotlib.pyplot as plt
plt.style.use ('classic')
from watex.datasets import fetch_data
from watex.view import ExPlot
data = fetch_data ('bagoue original').get('data=dfy1')
p= ExPlot(tname='flow', fig_size =(7, 5)).fit(data)
p.plotbv(xname='flow', yname='ohmS', kind='boxen')
<'ExPlot':xname='flow', yname='ohmS' , tname='flow'>
Total running time of the script: (0 minutes 0.101 seconds)