Note
Go to the end to download the full example code or to run this example in your browser via Binder
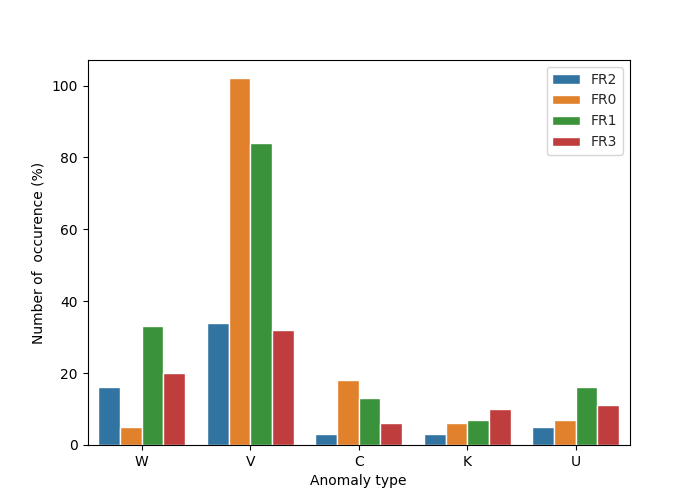
Plot base distributions#
plots the base-histogram and bar-distribution from categorized labels.
# Author: L.Kouadio
# Licence: BSD-3-clause
from watex.view.plot import QuickPlot
from watex.datasets import load_bagoue
data = load_bagoue ().frame
qplotObj= QuickPlot(xlabel = 'Anomaly type',
                                    ylabel='Number of  occurence (%)',
                                    lc='b', tname='flow')
qplotObj.fig_size = (7, 5)
qplotObj.sns_style = 'ticks'
qplotObj.fit(data)
# uncomment this for numerical plots views
# qplotObj. barcatdist(basic_plot =False,
#                                             groupby=['shape' ])
# for categorization data of staep 2 can be fetched
# and plot as
from watex.datasets import fetch_data
data = fetch_data ('Bagoue original').get ('data=dfy2')
qplotObj.fit(data). barcatdist(basic_plot =False,
                                              groupby=['shape' ])
QuickPlot(savefig= None, fig_num= 1, fig_size= (7, 5), ... , classes= None, tname= flow, mapflow= False)
Total running time of the script: (0 minutes 0.211 seconds)