Note
Go to the end to download the full example code or to run this example in your browser via Binder
Plot phase sensitive skew#
shows the phase sensitivity Skew that represents a measure of the skew of the phases of the impedance tensor
# Author: L.Kouadio
# Licence: BSD-3-clause
Skew is a dimensionality tool or a conventional asymmetry parameter based on the Z magnitude. Indeed, the EM signal is influenced by several factors such as the dimensionality of the propagation medium and the physical anomalies, which can distort the EM field both locally and regionally. The distortion of Z was determined from the quantification of its asymmetry and the deviation from the conditions that define its dimensionality. The parameters used for this purpose are all rotational invariant because the Z components involved in its definition are independent of the orientation system used. The conventional asymmetry parameter based on the Z magnitude is the skew defined by Swift (1967) as follows:
When the \(skew_{swift}\) is close to 0., we assume a 1D or 2D model
when the \(skew_{swift}\) is greater than >=0.2, we assume 3D local
anomaly (Bahr, 1991; Reddy et al., 1977).
Furthermore, Bahr (1988) proposed the phase-sensitive skew which calculates the skew taking into account the distortions produced in Z over 2D structures by shallow conductive anomalies and is defined as follows:
Note that The phase differences between two complex numbers \(C_1\) and \(C_2\) and the corresponding amplitude products are now abbreviated by the commutators:
Indeed, \(skew_{Bahr}\) measures the deviation from the symmetry condition
through the phase differences between each pair of tensor elements, considering
that phases are less sensitive to surface distortions(i.e. galvanic distortion).
The \(skew_{Bahr}\) threshold is set at 0.3 and higher values mean
3D structures (Bahr, 1991).
In this demonstration, we will plot skew with a sample of 20 files and we start by importing the required modules
import watex as wx
Barh method
edi_sk = wx.fetch_data ("edis", return_data =True , samples = 20 )
# we can set the Barh threshold line by setting the threshold line to 'Barh'
wx.utils.plot_skew (edi_sk, method ='bahr', threshold_line='bahr', fig_size = (11, 5), style ='classic')
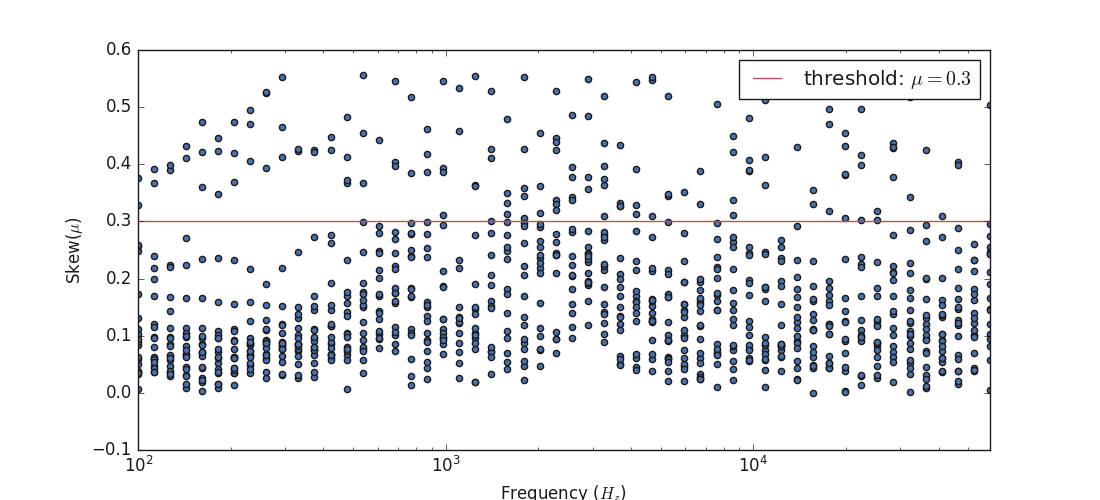
<AxesSubplot:xlabel='Frequency ($H_z$)', ylabel='Skew($\\mu$)'>
Swift method
wx.utils.plot_skew (edi_sk, method ='swift', threshold_line='swift', fig_size = (11, 5),
                    mode='periods')
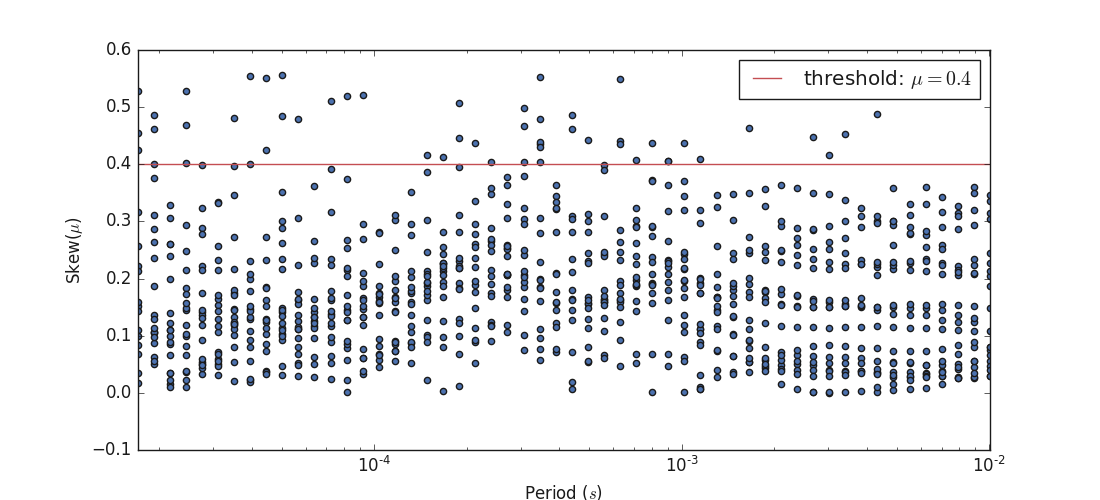
<AxesSubplot:xlabel='Period ($s$)', ylabel='Skew($\\mu$)'>
Total running time of the script: (0 minutes 0.818 seconds)