Note
Go to the end to download the full example code or to run this example in your browser via Binder
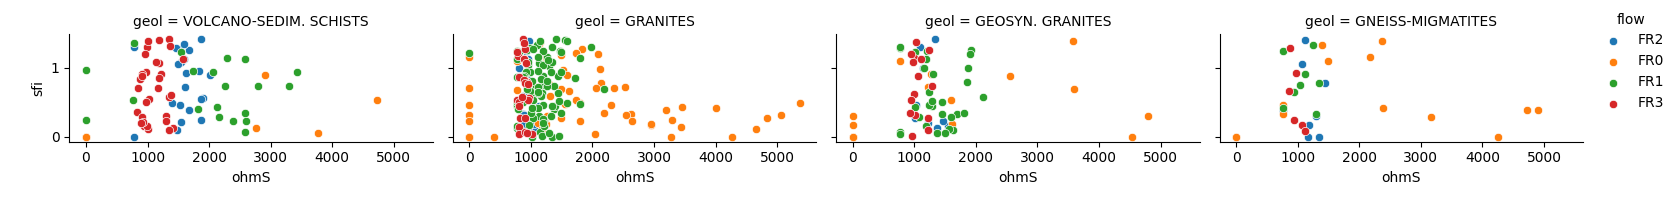
Plot discussing features#
maps a dataset onto multiple axes arrayed in a grid of rows and columns that correspond to the level of features in the dataset.
# Author: L.Kouadio
# Licence: BSD-3-clause
from watex.view.plot import  QuickPlot
from watex.datasets import load_bagoue
data = load_bagoue ().frame
qkObj = QuickPlot(  leg_kws={'loc':'upper right'},
              fig_title = '`sfi` vs`ohmS|`geol`',
                )
qkObj.tname='flow' # target the DC-flow rate prediction dataset
qkObj.mapflow=True  # to hold category FR0, FR1 etc..
qkObj.fit(data)
sns_pkws={'aspect':2 ,
              "height": 2,
                      }
map_kws={'edgecolor':"w"}
qkObj.discussingfeatures(features =['ohmS', 'sfi','geol', 'flow'],
                           map_kws=map_kws,  **sns_pkws
                             )
QuickPlot(savefig= None, fig_num= 1, fig_size= (12, 8), ... , classes= None, tname= flow, mapflow= True)
Total running time of the script: (0 minutes 0.968 seconds)