Note
Go to the end to download the full example code or to run this example in your browser via Binder
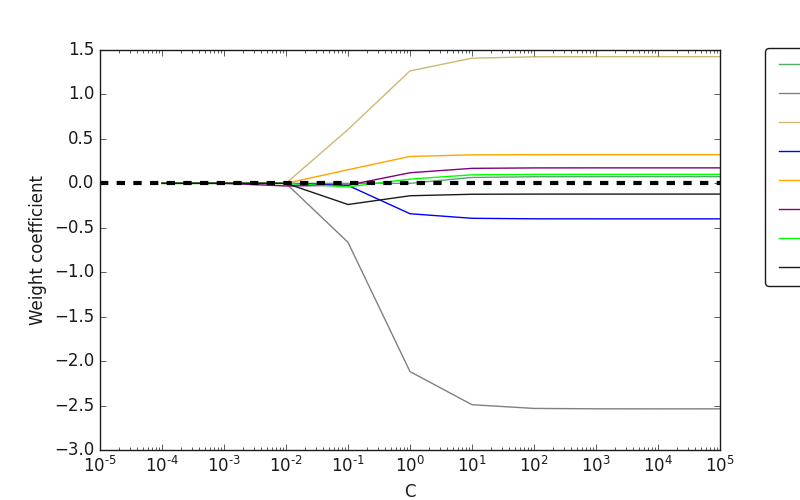
Plot regularization path#
visualizes the regularisation path from Logit/LogisticRegression by modifying at every iteration a bit more the different regularization strengths.
# Author: L.Kouadio
# Licence: BSD-3-clause
import matplotlib.pyplot as plt
from watex.utils.plotutils import plot_regularization_path
from watex.datasets import fetch_data
plt.style.use ('classic')
X, y = fetch_data ('bagoue analysed' ) # data aleardy standardized
plot_regularization_path (X, y )
Total running time of the script: (0 minutes 0.477 seconds)