Note
Go to the end to download the full example code or to run this example in your browser via Binder
Plot confidence in EM data#
plot the confidence in the data to determine the weak and useless signals for restoring or deleting.
# Author: L.Kouadio
# Licence: BSD-3-clause
The default tensor for evaluating the data confidence is the resistivity at TE mode (‘xy’).
Check confidence in the data before starting the concrete processing
seems meaningful. In the area with complex terrain, with high topography
addition to interference noises, signals are weals or missing
especially when using AMT survey. The most common technique to
do this is to eliminate the bad frequency and interpolate the remains one.
However, the tricks for eliminating frequency differ from one author
to another. Here, the tip using the data confidence seems meaningful
to indicate which frequencies to eliminate (at which stations/sites)
and which ones are still recoverable using the tensor recovering
strategy (zrestore())
The plot implements three levels of confidence:
High confidence: \(conf. \geq 0.95\) values greater than 95%
Soft confidence: \(0.5 \leq conf. < 0.95\). The data in this confidence range can be beneficial for tensor recovery to restore the weak and missing signals.
bad confidence: \(conf. <0.5\). Data in this interval must be deleted.
In the following, we used 25 samples of EDI data from a locality
where AMT data is collected with strong interference noises.
%%
* Plot confidence in two-dimensional view
Two-dimensional view is ensured by the parameter view set to 2d.
import watex as wx
from watex.utils import plot_confidence_in
edi_data= wx.fetch_data ( 'huayuan', samples = 25, key='raw', return_data =True, clear_cache =True)
plot_confidence_in (edi_data , distance =20 ,  view ='2d', figsize =(6, 2)
                     )
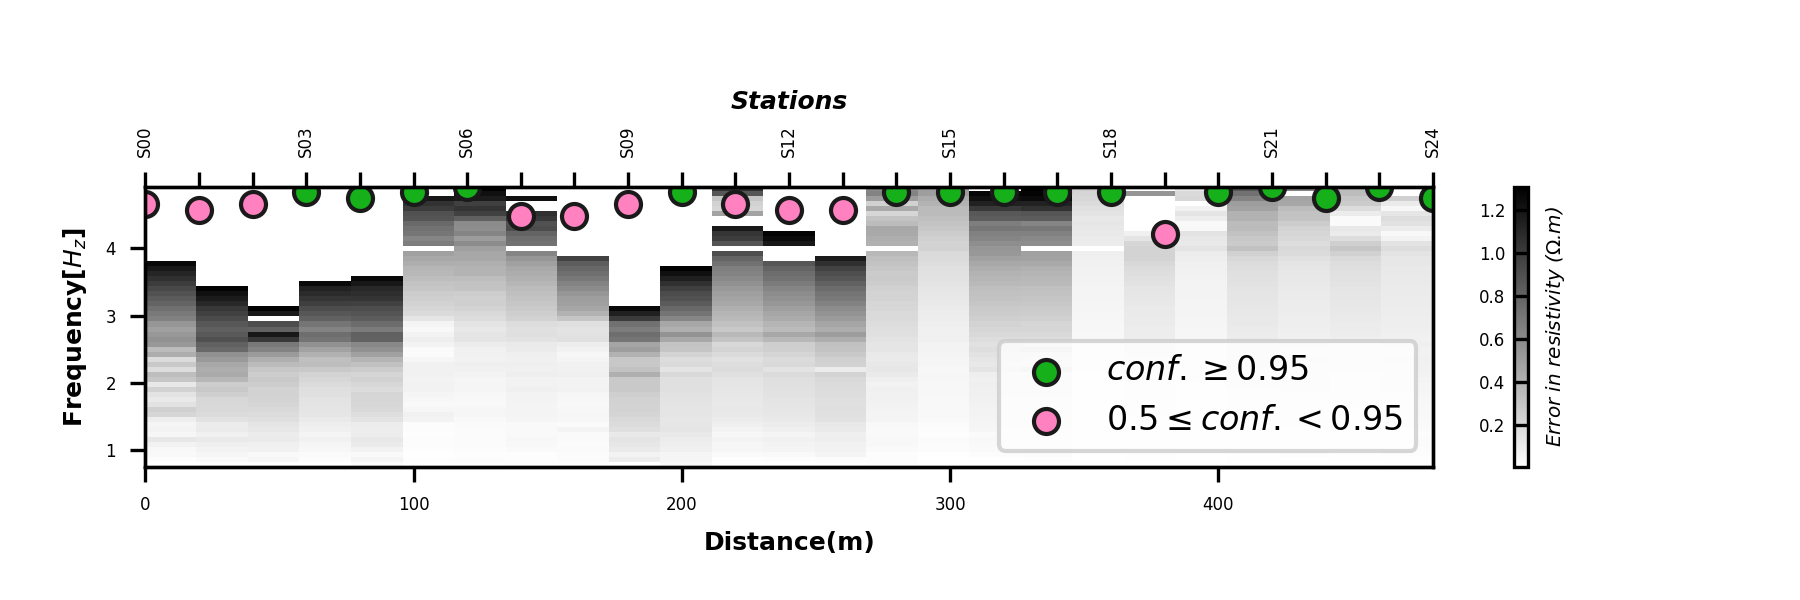
<AxesSubplot:xlabel='Distance(m)', ylabel='Frequency[$H_z$]'>
Plot one-dimensional confidency in EDI data
Turn of view parameter to None to visualize the one dimensional
view or use any other value passed to the view parameter.
Here is an example in confidencity plot in 1D.
plot_confidence_in (edi_data , distance =20 , figsize =(6, 3),fontsize =5,)
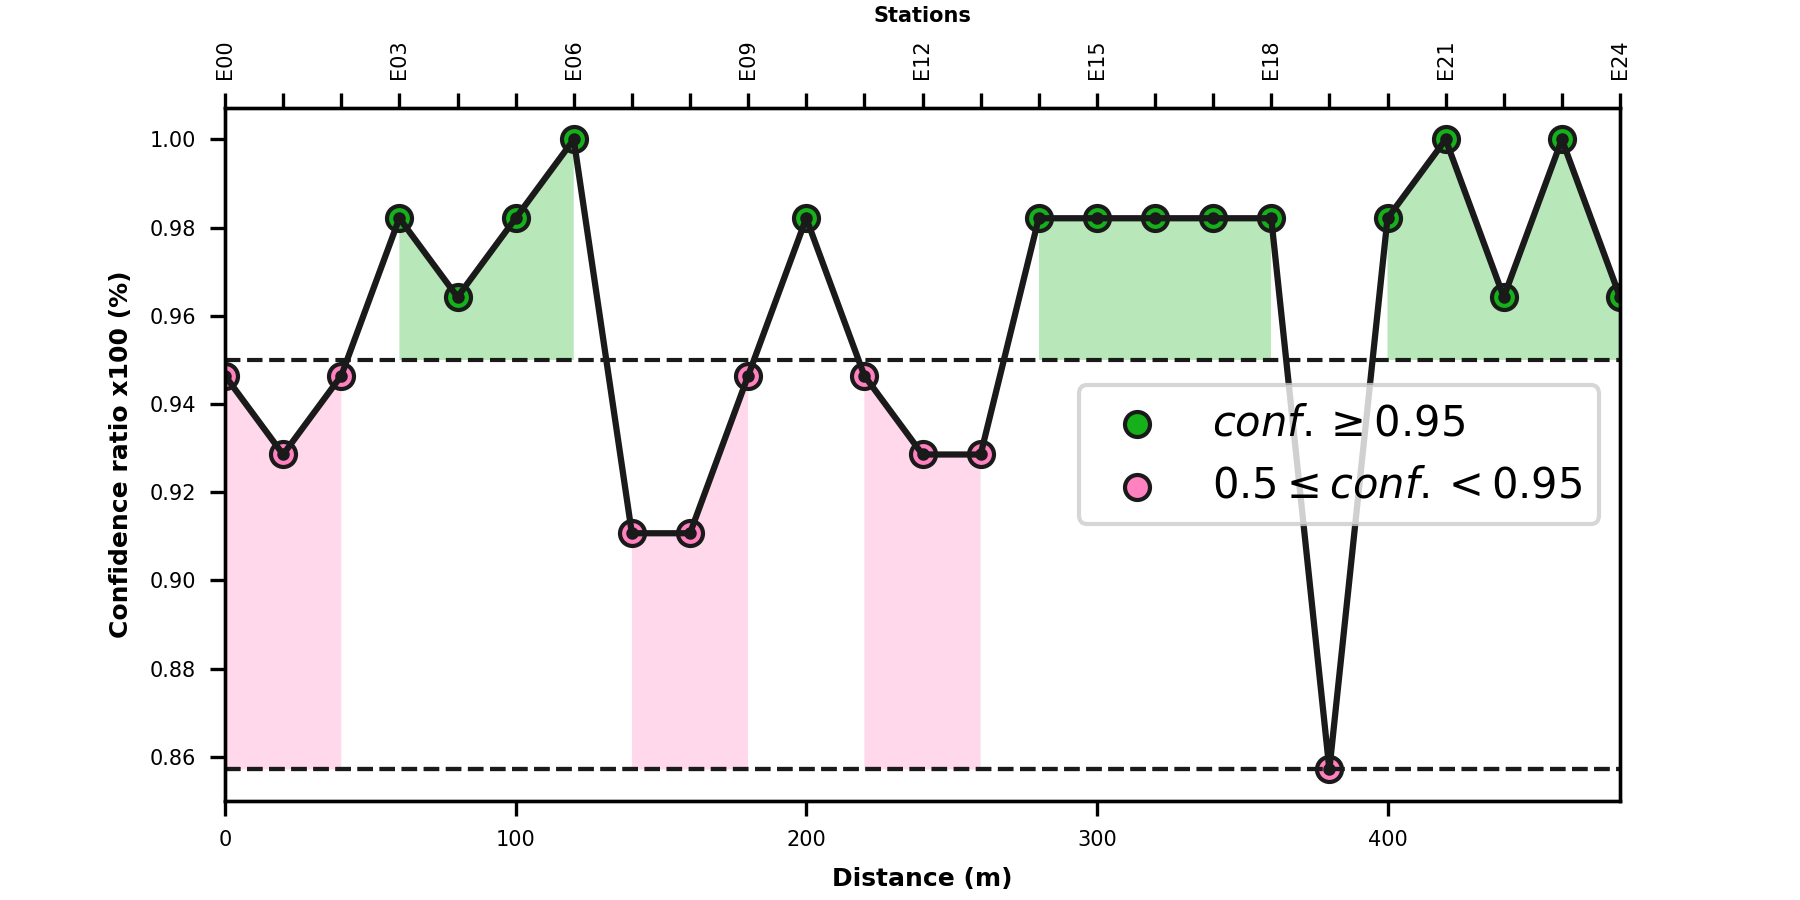
<AxesSubplot:xlabel='Distance (m)', ylabel='Confidence ratio x100 (%)'>
Total running time of the script: (0 minutes 1.382 seconds)