Note
Go to the end to download the full example code or to run this example in your browser via Binder
Plot multiple sites signal recovery#
plots mutiple site/stations tensors with recovery signals
# Author: L.Kouadio
# Licence: BSD-3-clause
from watex.view.plot import TPlot
from watex.datasets import load_edis
# takes the 03 samples of EDIs
edi_data = load_edis (return_data= True, samples =41 )
t= TPlot(fig_size =(9, 7), font_size =7., show_grid =True, gwhich='both')
t.fit(edi_data).plot_multi_recovery (
    sites =['S00', 'S05', 'S10',  'S20'],
    colors =['ok-',  'xr-.', '^b-', 'oc-.']
    )
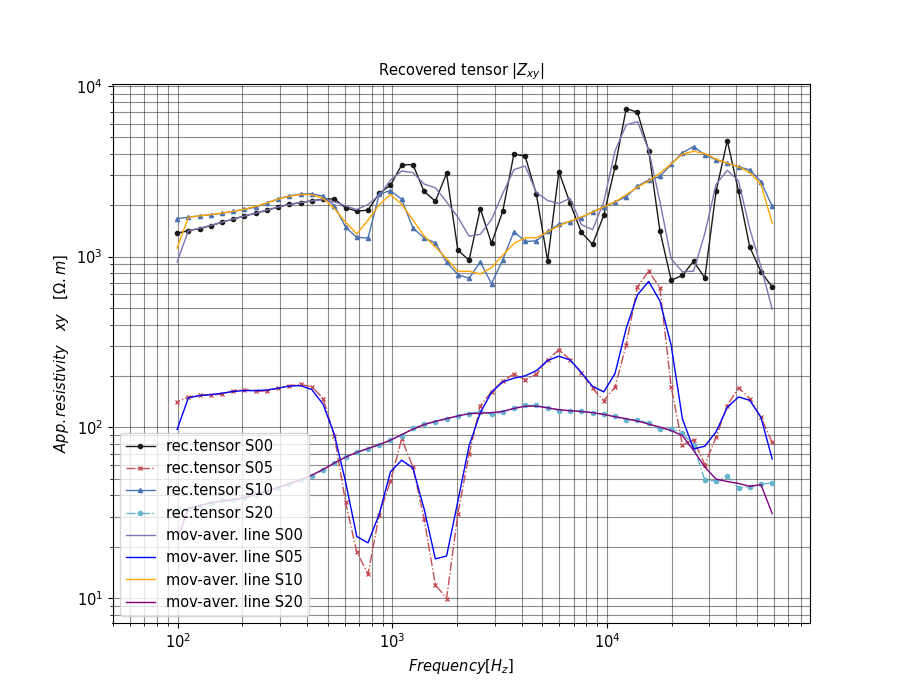
<AxesSubplot:title={'center':'Recovered tensor $|Z_{xy}|$'}, xlabel='$Frequency [H_z]$', ylabel='$ App.resistivity \\quad xy \\quad [ \\Omega.m]$'>
Total running time of the script: (0 minutes 1.295 seconds)