Note
Go to the end to download the full example code or to run this example in your browser via Binder
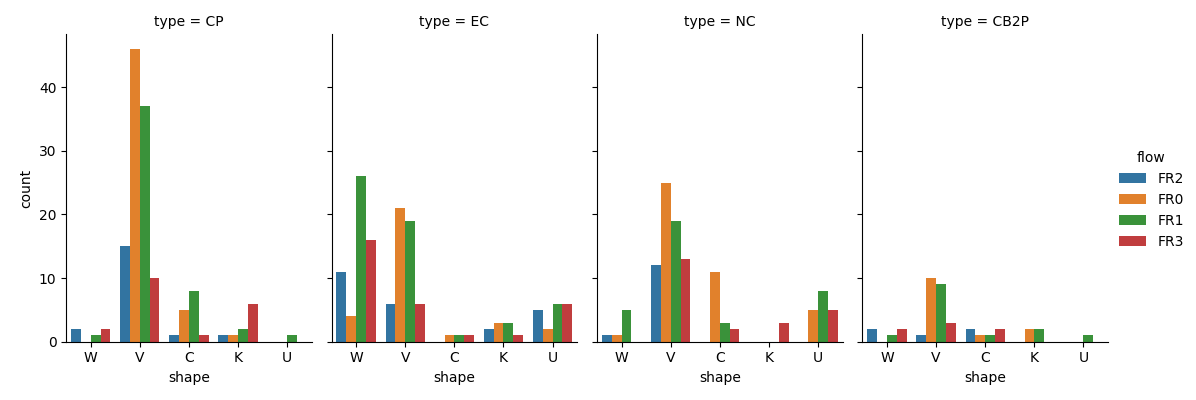
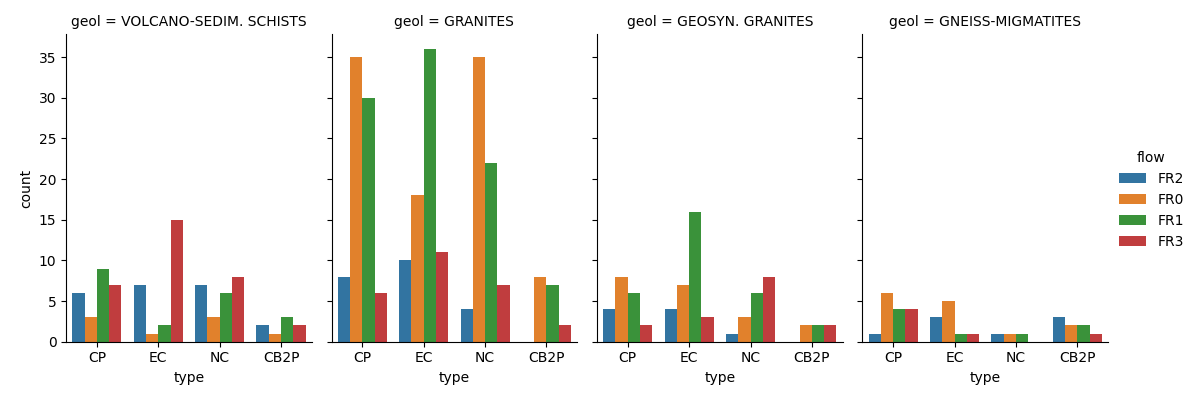
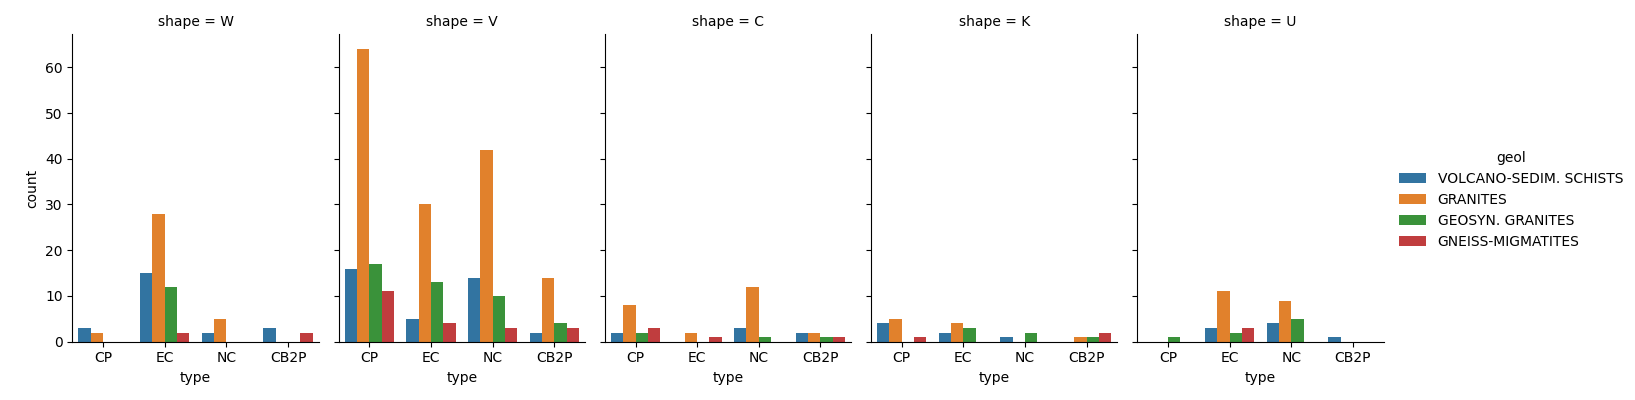
Plot multiple categorical feature distributions#
plots a multiple categorical distributions onto a FacetGrid
# Author: L.Kouadio
# Licence: BSD-3-clause
from watex.view.plot import QuickPlot
from watex.datasets import load_bagoue
data = load_bagoue ().frame
qplotObj= QuickPlot(lc='b', tname='flow')
qplotObj.sns_style = 'darkgrid'
qplotObj.mapflow=True # to categorize the flow rate
qplotObj.fit(data)
fdict={
           'x':['shape', 'type', 'type'],
           'col':['type', 'geol', 'shape'],
           'hue':['flow', 'flow', 'geol'],
           }
qplotObj.multicatdist(**fdict)
QuickPlot(savefig= None, fig_num= 1, fig_size= (12, 8), ... , classes= None, tname= flow, mapflow= True)
Total running time of the script: (0 minutes 3.467 seconds)