Note
Go to the end to download the full example code or to run this example in your browser via Binder
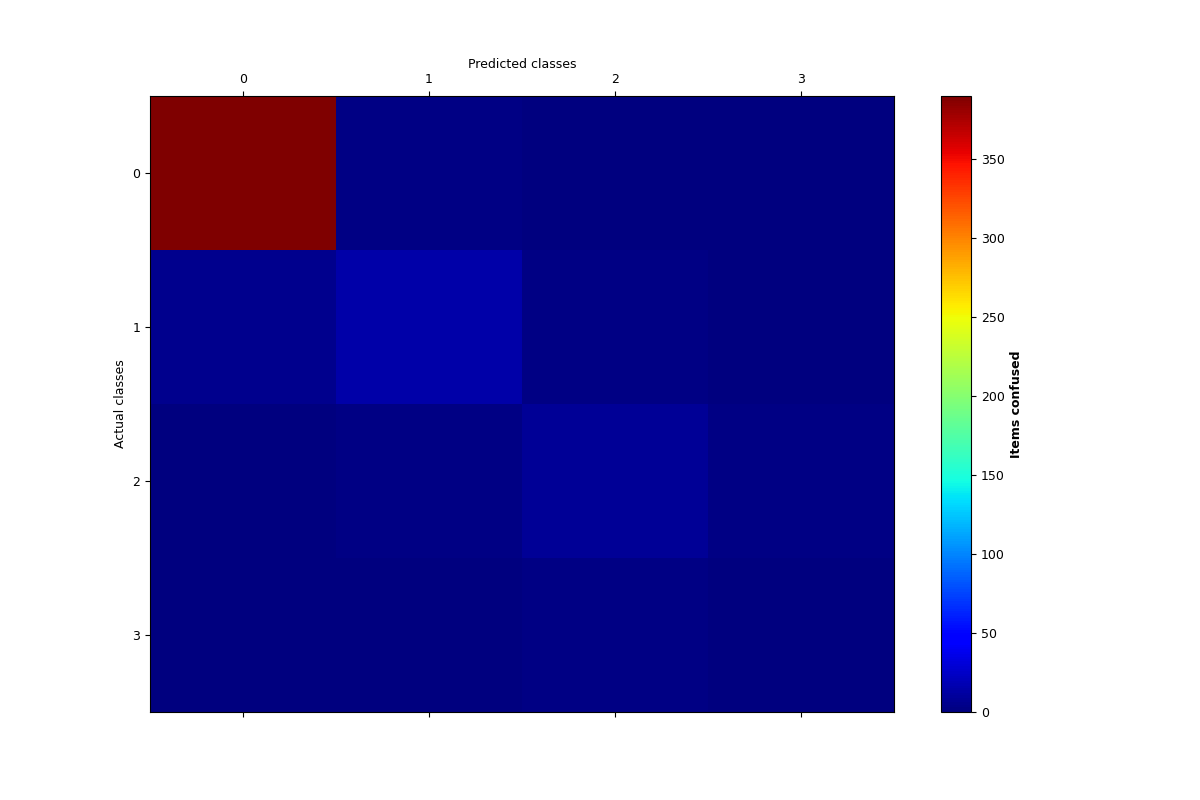
Plot confusion matrix metric#
displays the confusion matrix for errors analysis.
# Author: L.Kouadio
# Licence: BSD-3-clause
Fetch data and evaluate the model
from watex.datasets import fetch_data
from watex.exlib.sklearn import SVC
from watex.view.mlplot import EvalPlot
X, y = fetch_data ('bagoue', return_X_y=True, as_frame =True)
# partition the target into 4 clusters-> just for demo
b= EvalPlot(scale =True, label_values = 4 )
b.fit_transform (X, y)
# prepare our estimator
svc_clf = SVC(C=100, gamma=1e-2, kernel='rbf', random_state =42)
matshow_kwargs ={
        'aspect': 'auto', # 'auto'equal
        'interpolation': None,
       'cmap':'jet' }
plot_kws ={'lw':3,
       'lc':(.9, 0, .8),
       'font_size':15.,
        'cb_format':None,
        'xlabel': 'Predicted classes',
        'ylabel': 'Actual classes',
        'font_weight':None,
        'tp_labelbottom':False,
        'tp_labeltop':True,
        'tp_bottom': False
        }
b.plotConfusionMatrix(clf=svc_clf,
                          matshow_kws = matshow_kwargs,
                          **plot_kws)
svc_clf = SVC(C=100, gamma=1e-2, kernel='rbf',
                 random_state =42)
/home/docs/checkouts/readthedocs.org/user_builds/watex/envs/0.3.1/lib/python3.10/site-packages/sklearn/model_selection/_split.py:737: UserWarning:

The least populated class in y has only 2 members, which is less than n_splits=5.
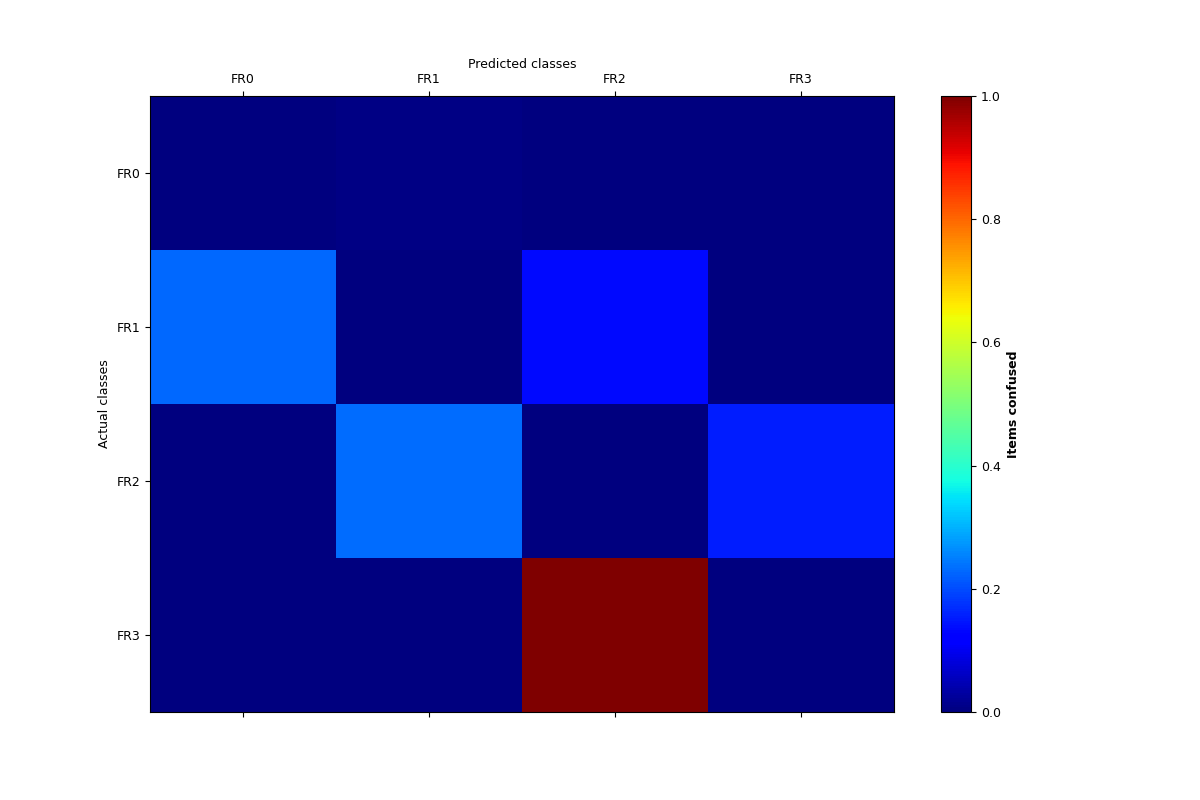
visualize the error of confused items rather than samples replace the integer identifier with litteral string
b.litteral_classes = ['FR0', 'FR1', 'FR2', 'FR3']
b.plotConfusionMatrix(svc_clf, matshow_kws=matshow_kwargs,
                          kind='error', **plot_kws)
#Note the confusion items areas.
/home/docs/checkouts/readthedocs.org/user_builds/watex/envs/0.3.1/lib/python3.10/site-packages/numpy/lib/arraysetops.py:612: FutureWarning:

elementwise comparison failed; returning scalar instead, but in the future will perform elementwise comparison

/home/docs/checkouts/readthedocs.org/user_builds/watex/envs/0.3.1/lib/python3.10/site-packages/sklearn/model_selection/_split.py:737: UserWarning:

The least populated class in y has only 2 members, which is less than n_splits=5.


EvalPlot(tname= None, objective= None, scale= True, ... , sns_height= 4.0, sns_aspect= 0.7, verbose= 0)
Total running time of the script: (0 minutes 1.035 seconds)