Note
Go to the end to download the full example code or to run this example in your browser via Binder
Plot elbow#
visualize the elbow method to find the optimal number of cluster for a given data.
# Author: L.Kouadio
# Licence: BSD-3-clause
from watex.datasets import load_hlogs
from watex.utils.plotutils import plot_elbow
# get the only resistivy and gamma-gama values for example
res_gamma = load_hlogs ().frame[['resistivity', 'gamma_gamma']]
plot_elbow(res_gamma, n_clusters=11)
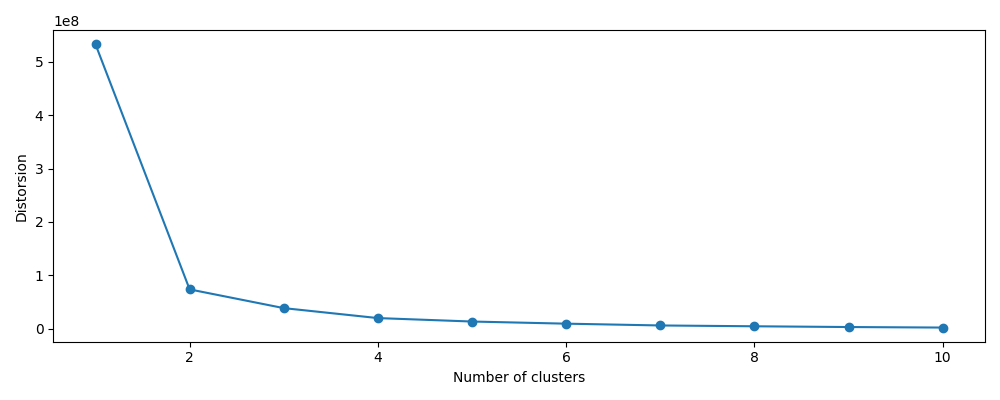
<AxesSubplot:xlabel='Number of clusters', ylabel='Distorsion'>
Total running time of the script: (0 minutes 0.496 seconds)