Note
Go to the end to download the full example code or to run this example in your browser via Binder
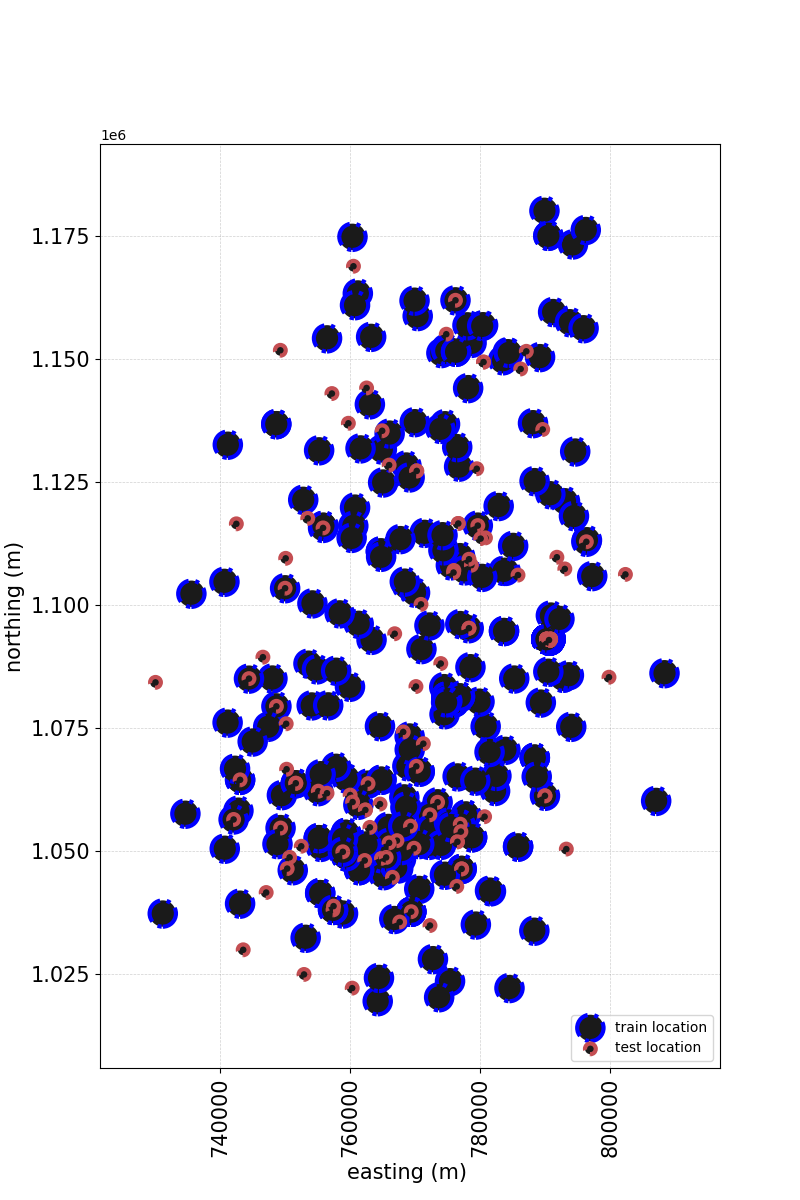
Plot projection#
creates a scatterplot of all instances to visualize data alongside the geographical information. e
# Author: L.Kouadio
# Licence: BSD-3-clause
The plot needs the coordinates informations of the survey area. If there is there is geographical information(latitude/longitude or easting/northing) in the data, plot shows the distribution of the data and can be used to visualize the location of the correct of wrong predicted value in the survey area.
from watex.datasets import fetch_data
from watex.view.mlplot import plotProjection
# Discard all the non-numeric data
# then inut numerical data
from watex.utils import to_numeric_dtypes, naive_imputer
X, Xt, *_ = fetch_data ('bagoue', split_X_y =True, as_frame =True)
X =to_numeric_dtypes(X, pop_cat_features=True )
X= naive_imputer(X)
Xt = to_numeric_dtypes(Xt, pop_cat_features=True )
Xt= naive_imputer(Xt)
plot_kws = dict (fig_size=(8, 12),
                 lc='k',
                 marker='o',
                 lw =3.,
                 font_size=15.,
                 xlabel= 'easting (m) ',
                 ylabel='northing (m)' ,
                 marker_facecolor ='k',
                 marker_edgecolor='blue',
                 alpha =1.,
                 marker_edgewidth=2.,
                 show_grid =True,
                 galpha =0.2,
                 glw=.5,
                 rotate_xlabel =90.,
                 fs =3.,
                 s =None )
plotProjection( X, Xt , columns= ['east', 'north'],
                    trainlabel='train location',
                    testlabel='test location',
                    #test_kws = dict (color = "r", edgecolor="#0A4CEE"),
                    **plot_kws
                   )
Total running time of the script: (0 minutes 0.337 seconds)