Note
Go to the end to download the full example code or to run this example in your browser via Binder
Plot strike#
plot the strike estimated from the invariants and phase tensor in either a rose diagram of xy plot.
# Author: L.Kouadio
# Licence: BSD-3-clause
plot_strike() plots strike angle as determined by
phase tensor azimuth (Weaver et al.2003 1 ; Caldwell et al. 2004 2)
and invariants of the impedance tensor. In the following example, we called
a sample of EDI collected in Huayuan locality, Hunan province, China,
stored as inner datasets. Moreover, plot_strike()
uses either MTpy or pyCSAMT as dependency. Use pip for
installation if is not installed yet:
We start by importing the required modules as:
import os
from watex.datasets import fetch_data
from watex.utils.plotutils import plot_strike
from watex.datasets.io import get_data # get edidata stored in cache
Before we’ll make a collection of EDI data and call
watex.utils.plot_strike() for plotting as:
fetch_data ( 'huayuan', samples = 25 ) # store 25 edis in cache

edi_fn_lst = [os.path.join(get_data(),f) for f in os.listdir(get_data())
         if f.endswith('.edi')]

plot_strike(edi_fn_lst )
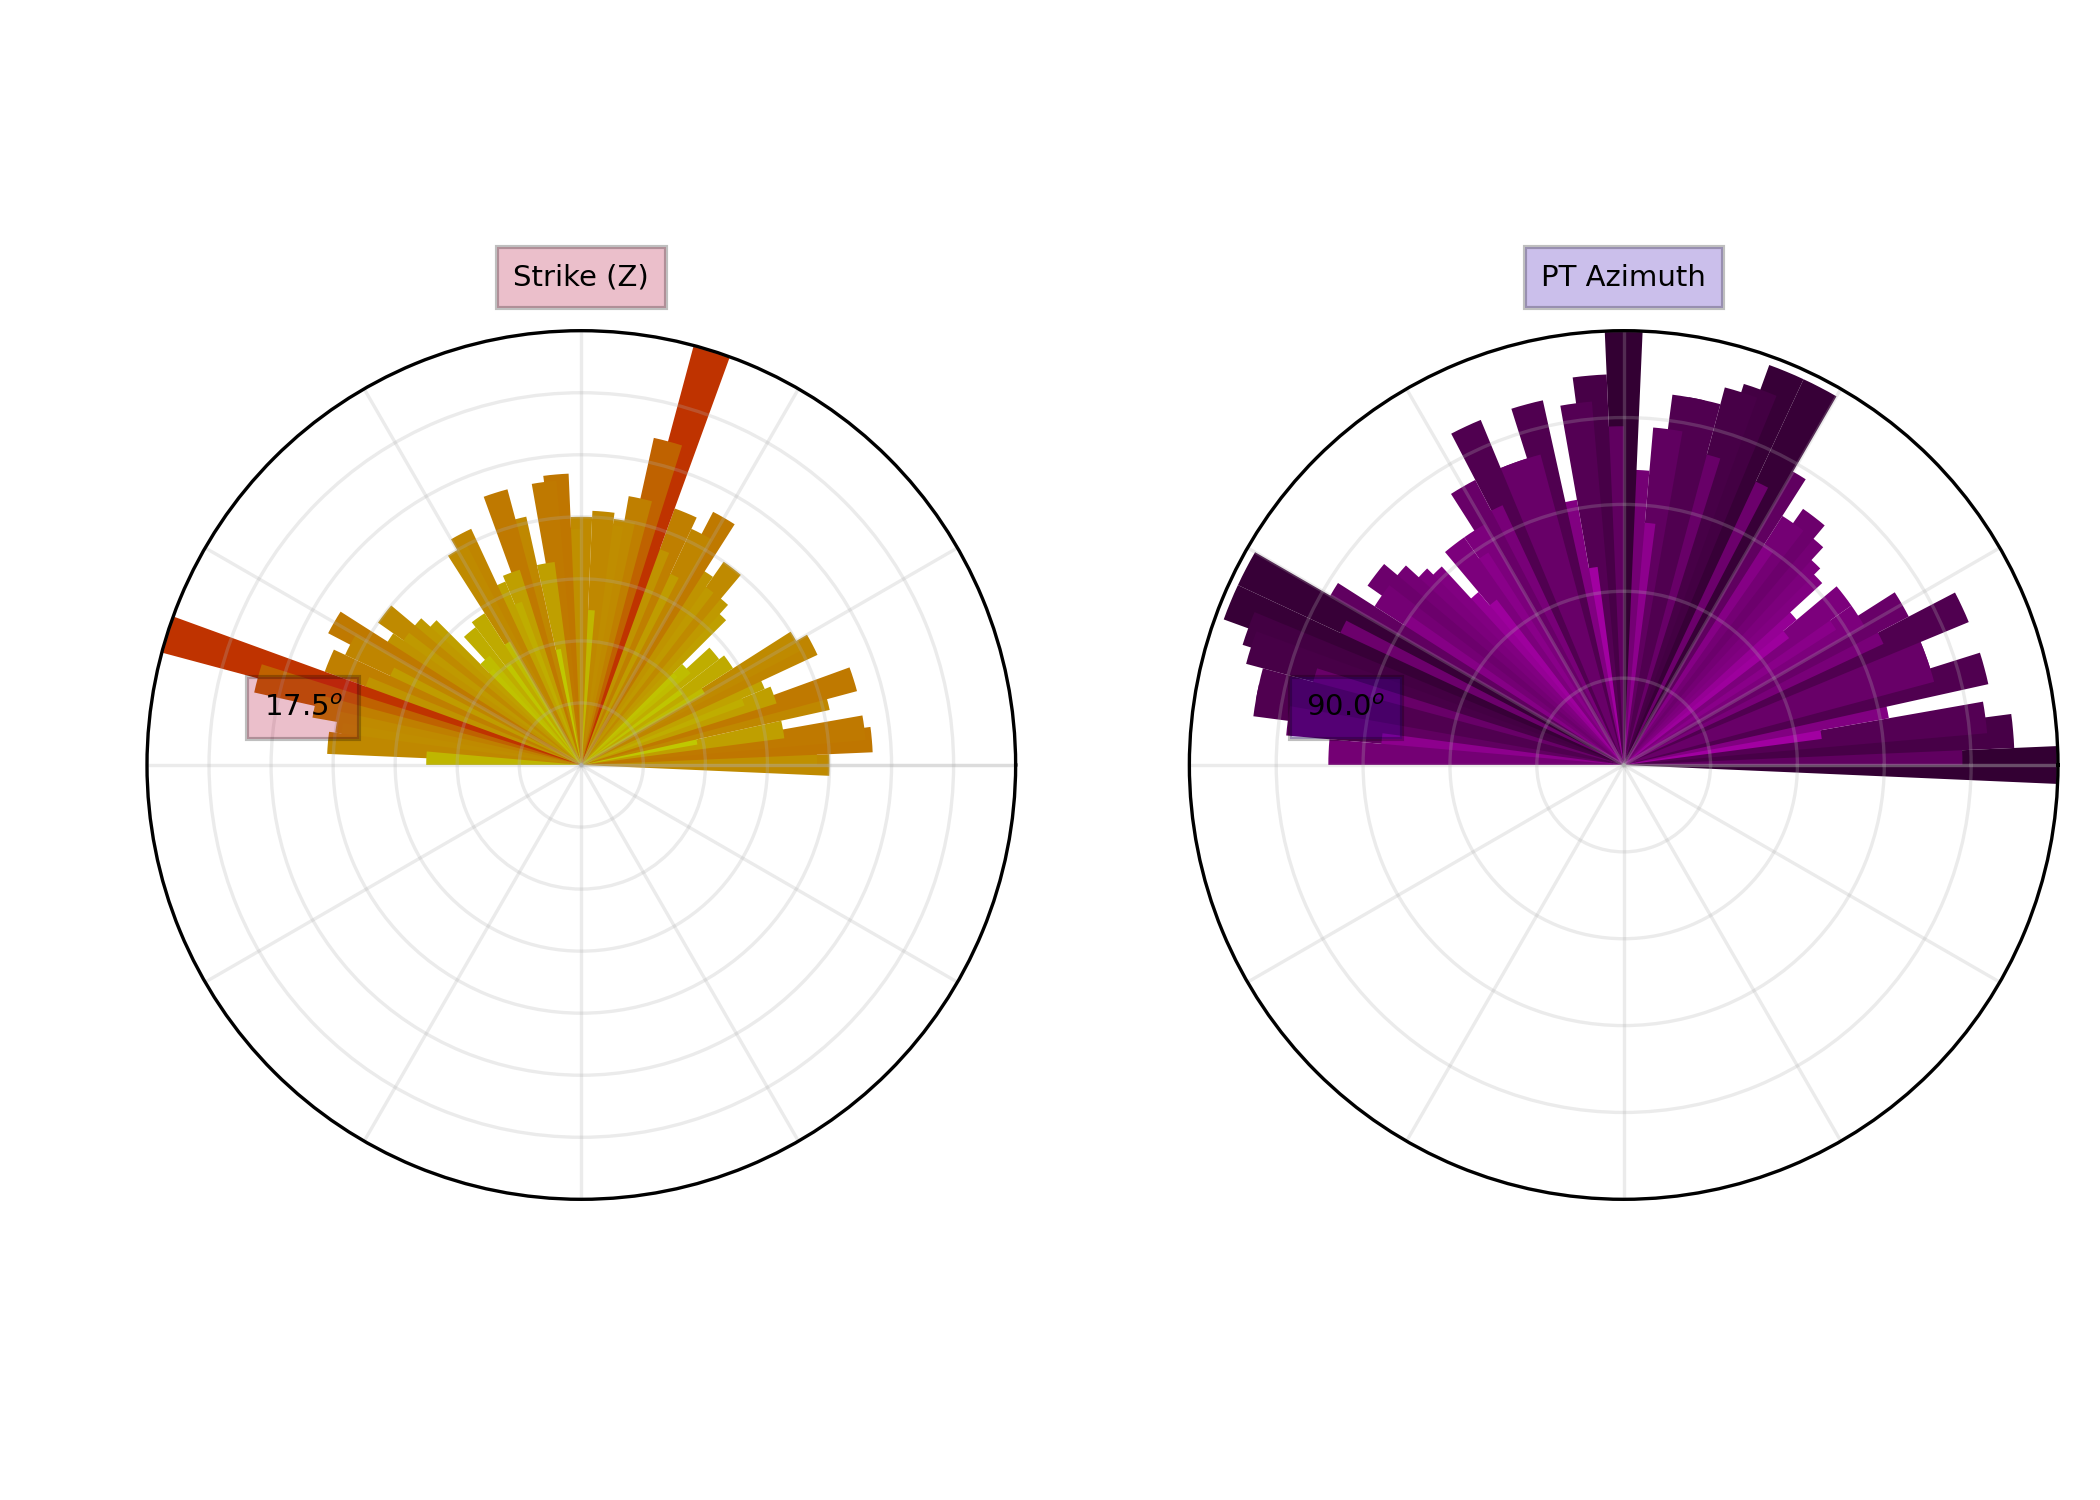
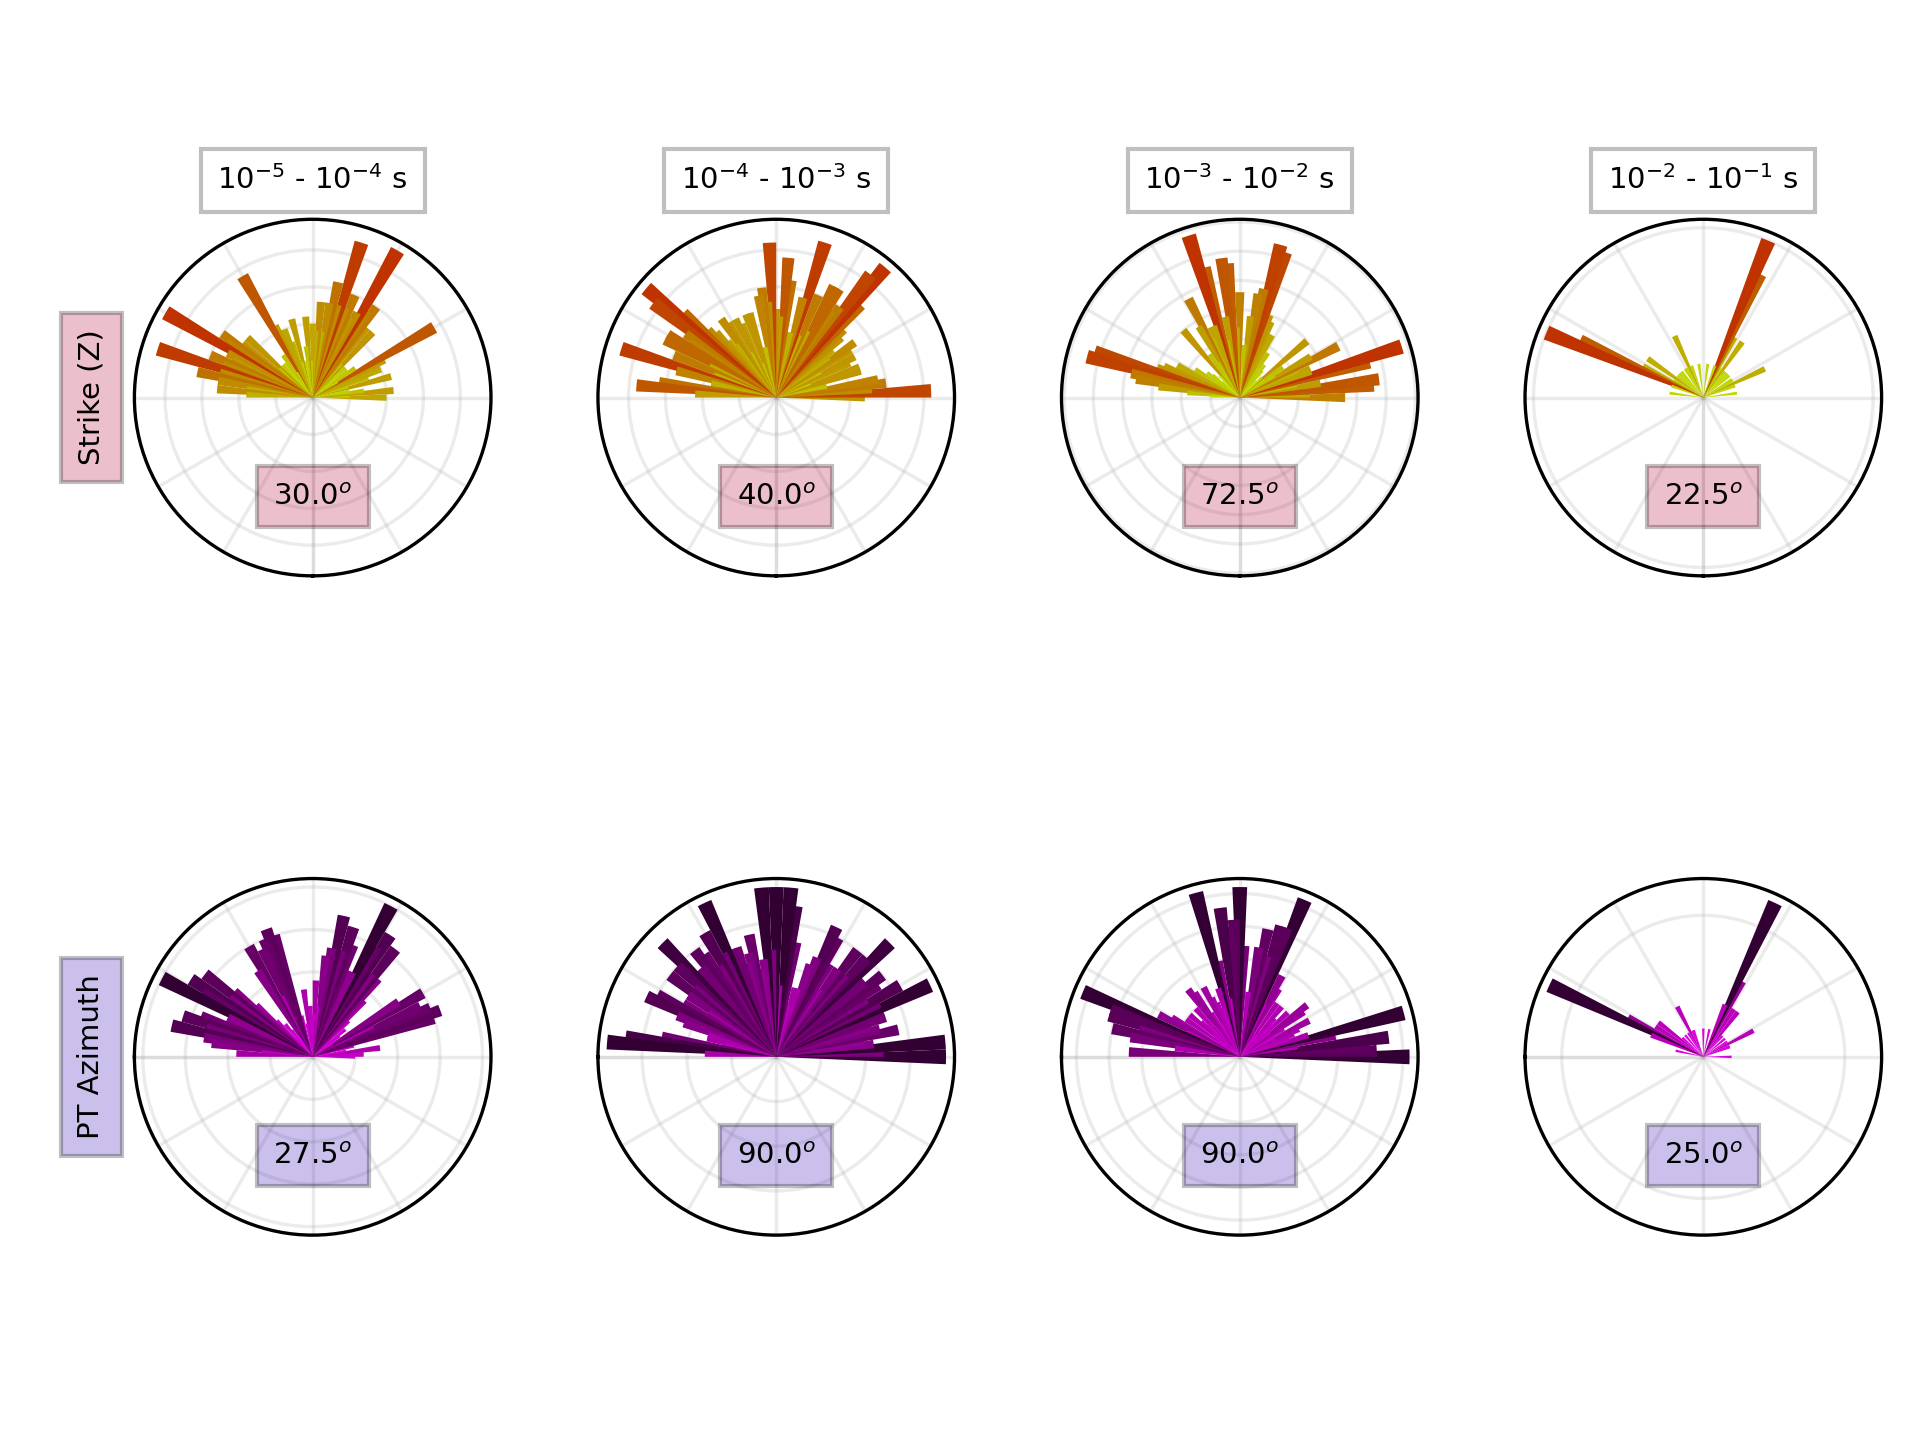
by default, plot_strike() plots all period ranges into
one polar diagram for each strike angle estimation with kind=2. To plot
individual decades into one plot, set the kind parameter to 1 as:
plot_strike(edi_fn_lst , kind = 1 )
References
- 1
Weaver J.T, Lilley F.E.M.(2003) Invariants of rotation of axes and indicators of dimensionality in magnetotellurics, Australian National University, University of Victoria; http://bib.gfz-potsdam.de/emtf/2007/pdf/lilley.pdf
- 2
T. Grant Caldwell, Hugh M. Bibby, Colin Brown, The magnetotelluric phase tensor, Geophysical Journal International, Volume 158, Issue 2, August 2004, Pages 457–469, https://doi.org/10.1111/j.1365-246X.2004.02281.x
Total running time of the script: (0 minutes 7.852 seconds)