Note
Go to the end to download the full example code or to run this example in your browser via Binder
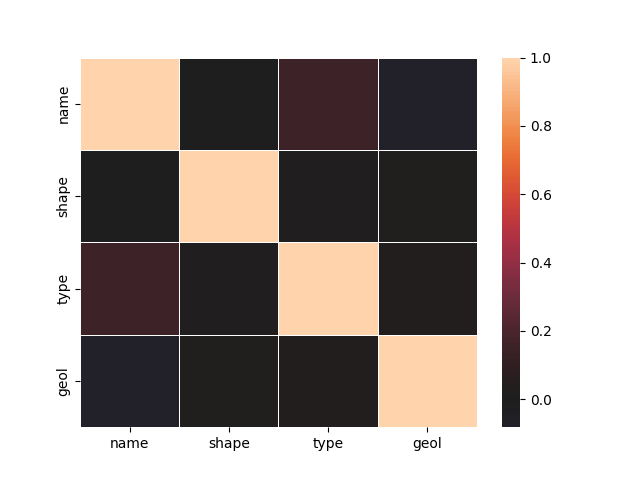
Plot correlating features#
plots the correlation between the numerical and categorical features.
# Author: L.Kouadio
# Licence: BSD-3-clause
#  Numeric or categorical features are set using the parameter `cortype.
# use  ``num`` or ``cat`` for numerical or categorical features respectively.

from watex.view.plot import QuickPlot
from watex.datasets import load_bagoue
data = load_bagoue ().frame
qplotObj = QuickPlot(fig_size = (7, 5)).fit(data)
sns_kwargs ={'annot': False,
          'linewidth': .5,
           'center':0 ,
            # 'cmap':'jet_r',
            'cbar':True}
qplotObj.corrmatrix(cortype='cat', **sns_kwargs)
# Uncomment this for  numeric correlation plot  set by default
#qplotObj.corrmatrix( **sns_kwargs)
QuickPlot(savefig= None, fig_num= 1, fig_size= (7, 5), ... , classes= None, tname= None, mapflow= False)
Total running time of the script: ( 0 minutes 0.227 seconds)