Note
Go to the end to download the full example code or to run this example in your browser via Binder
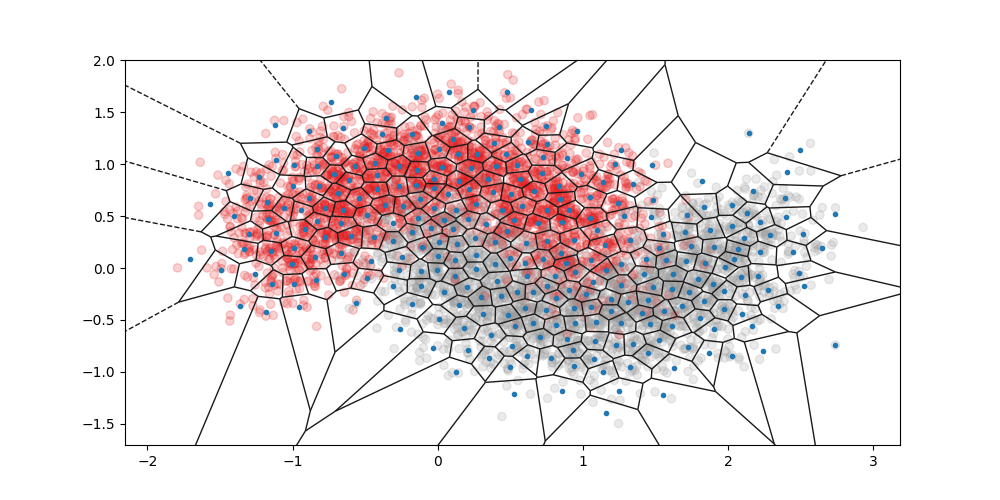
Plot Voronoi#
Plots the Voronoi diagram of the K-Means clusters overlaid with the data
# License: BSD-3-clause
# Author: K.Laurent
Import required modules
import matplotlib.pyplot as plt
import watex as wx
from sklearn.datasets import make_moons
from watex.utils import plot_voronoi
Plot the Voronoi function
fig,ax = plt.subplots ( 1, figsize = ( 10, 5 ))
X, y = make_moons (n_samples=5000, noise=0.3)
km = wx.sklearn.KMeans (n_clusters = 300, n_init ='auto').fit(X, y )
plot_voronoi ( X, y , cluster_centers = km.cluster_centers_, ax = ax , )
<AxesSubplot:>
Total running time of the script: ( 0 minutes 0.600 seconds)