Note
Go to the end to download the full example code or to run this example in your browser via Binder
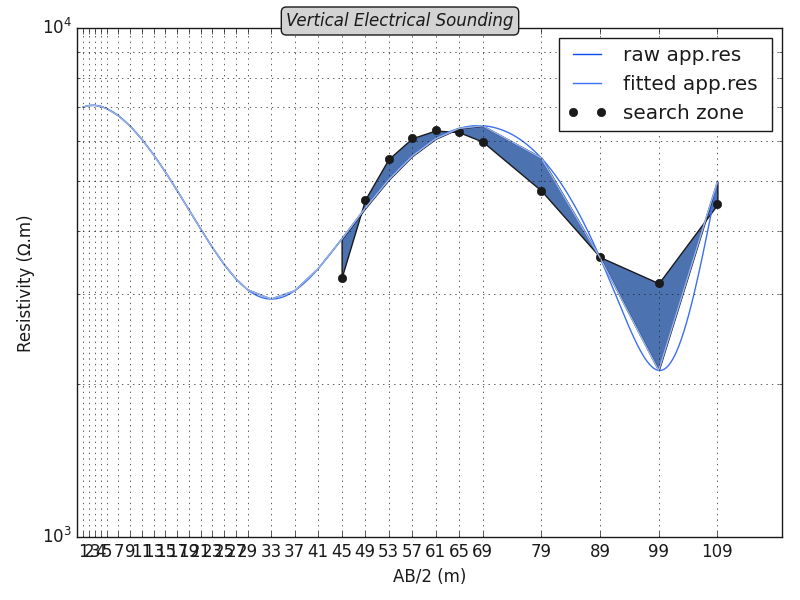
Plot ohmic-area#
visualizes the ohmic-area from the vertical electrical sounding data.
# Author: L.Kouadio
# Licence: BSD-3-clause
Generates a synthetic data using the function make_ves()
from watex.datasets import make_ves
from watex.utils.exmath import plotOhmicArea

ves_data = make_ves (min_rho = 10 , max_rho = 1e4, as_frame =True, seed=425,
                     iorder =5  )
plotOhmicArea (ves_data, style ='classic', colors =['#0A4CEE', "#3B70F2"],
               show_grid = True , fbtw=True )
Total running time of the script: ( 0 minutes 0.349 seconds)