Note
Go to the end to download the full example code or to run this example in your browser via Binder
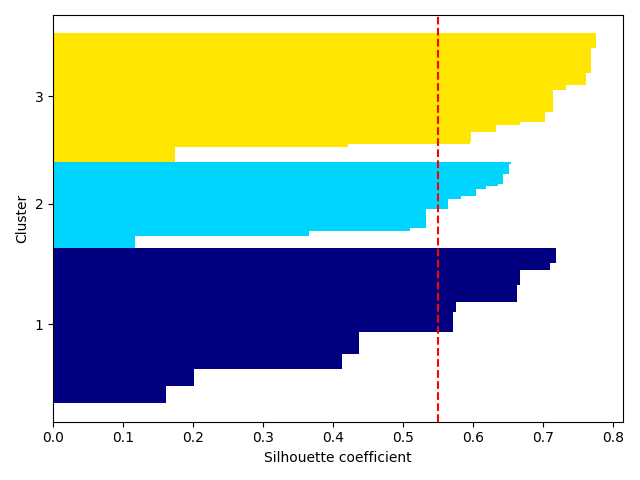
Plot naive silhouette#
quantifies the quality of clustering silhouette
# Author: L.Kouadio
# Licence: BSD-3-clause
import numpy as np
from watex.exlib.sklearn import KMeans
from watex.datasets import load_iris
from watex.utils.plotutils import plot_silhouette
d= load_iris ()
X= d.data [:, 0][:, np.newaxis] # take the first axis
km= KMeans (n_clusters =3 , init='k-means++', n_init =10 ,
                    max_iter = 300 ,
                    tol=1e-4,
                    random_state =0
                    )
y_km = km.fit_predict(X)
plot_silhouette (X, y_km)
Total running time of the script: ( 0 minutes 0.334 seconds)