Note
Go to the end to download the full example code or to run this example in your browser via Binder
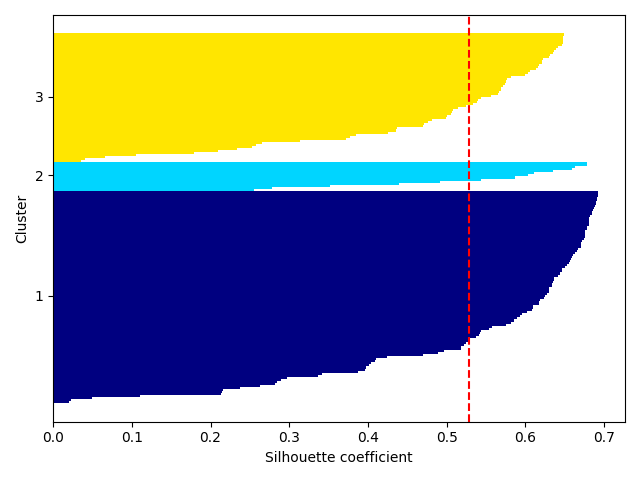
Plot silhouette#
plot the silhouette to quantify the quality of clustering samples.
# Author: L.Kouadio
# Licence: BSD-3-clause
from watex.datasets import load_hlogs
from watex.view.mlplot import plotSilhouette
# use resistivity and gamma for this demo
X_res_gamma = load_hlogs().frame[['resistivity', 'sp']]

# Plot silhouette with 'prefit' set to 'False'
plotSilhouette (X_res_gamma, prefit =False)
Total running time of the script: ( 0 minutes 0.414 seconds)