Note
Go to the end to download the full example code or to run this example in your browser via Binder
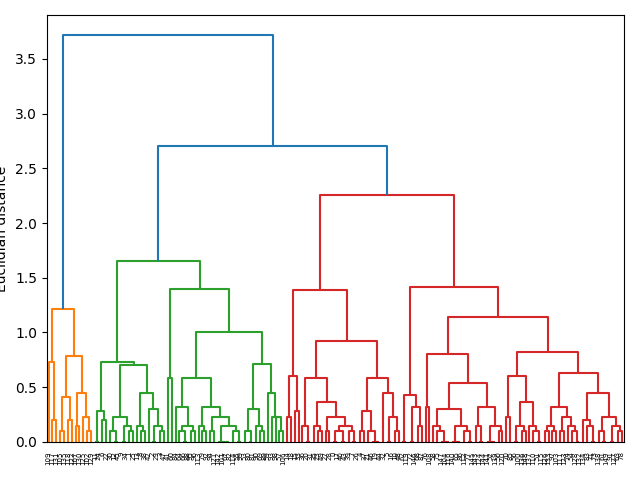
Plot dendrogram#
visualizes specific features on a dendrogram diagram
# Author: L.Kouadio
# Licence: BSD-3-clause
- Use the Iris dataset from
load_iris()and return
Boxspaceobjects where the the frame , feature_names and target_names are the attributes. Thus, rather than creating new columns to pass as`colums` arguments, we uses the feature_names attribute instead:
from watex.datasets import load_iris
from watex.view import plotDendrogram
data = load_iris () # return a box data objet
# print the five row of the iris dataframe
print(data.frame.head())
   sepal length (cm)  sepal width (cm)  ...  petal width (cm)  target
0                5.1               3.5  ...               0.2       0
1                4.9               3.0  ...               0.2       0
2                4.7               3.2  ...               0.2       0
3                4.6               3.1  ...               0.2       0
4                5.0               3.6  ...               0.2       0

[5 rows x 5 columns]
Print the feature names
print(data.feature_names )
['sepal length (cm)', 'sepal width (cm)', 'petal length (cm)', 'petal width (cm)']
Plot the dendrogram
plotDendrogram (data.frame, columns =data.feature_names[:2] )
Total running time of the script: ( 0 minutes 1.297 seconds)