Note
Go to the end to download the full example code or to run this example in your browser via Binder
Plot data with missing features#
plots the missing features and extracts insight with their correlation
# Author: L.Kouadio
# Licence: BSD-3-clause
Missing inherits from Data and use missingno. Install
the package missingno for taking advantage of many missing plot.
The parameter kind is passed to Missing for selecting the
kind of plot for visualisation:
Plot the missing in the data using the base visualization
from watex.datasets import fetch_data
from watex.base import Missing
data= fetch_data("bagoue original").get('data=df') # num flow
ms= Missing().fit (data)
ms.plot(figsize = (12, 4 ))
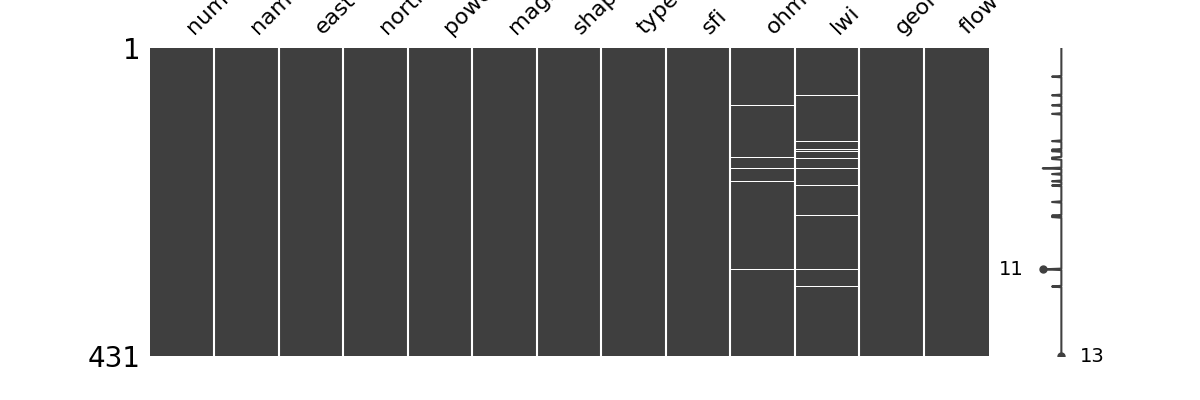
Missing(in_percent= False, kind= None, sample= None, ... , lwi= 0      32.023585
1      21.406531
2            0.0
3      28.709623
4            2.3
         ...
426         18.6
427         40.1
428         28.5
429          1.5
430        33.85
Name= lwi, Length= 431, dtype= object, geol= 0      VOLCANO-SEDIM. SCHISTS
1                    GRANITES
2                    GRANITES
3                    GRANITES
4            GEOSYN. GRANITES
                ...
426          GEOSYN. GRANITES
427                  GRANITES
428                  GRANITES
429                  GRANITES
430          GEOSYN. GRANITES
Name= geol, Length= 431, dtype= object, flow= 0       2.0
1       0.0
2       1.0
3       1.0
4       1.0
       ...
426    10.0
427     2.0
428     5.0
429     4.0
430     2.0
Name= flow, Length= 431, dtype= object)
Plot the same missing data using the correlation visualization
ms.kind='corr'
ms.plot(figsize = (12, 4 ))
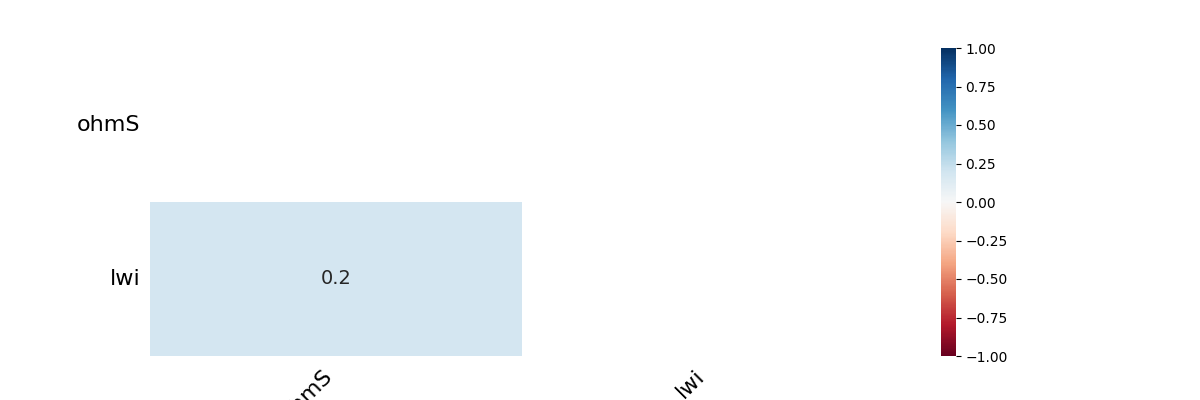
Missing(in_percent= False, kind= corr, sample= None, ... , lwi= 0      32.023585
1      21.406531
2            0.0
3      28.709623
4            2.3
         ...
426         18.6
427         40.1
428         28.5
429          1.5
430        33.85
Name= lwi, Length= 431, dtype= object, geol= 0      VOLCANO-SEDIM. SCHISTS
1                    GRANITES
2                    GRANITES
3                    GRANITES
4            GEOSYN. GRANITES
                ...
426          GEOSYN. GRANITES
427                  GRANITES
428                  GRANITES
429                  GRANITES
430          GEOSYN. GRANITES
Name= geol, Length= 431, dtype= object, flow= 0       2.0
1       0.0
2       1.0
3       1.0
4       1.0
       ...
426    10.0
427     2.0
428     5.0
429     4.0
430     2.0
Name= flow, Length= 431, dtype= object)
Total running time of the script: ( 0 minutes 0.369 seconds)