Note
Go to the end to download the full example code or to run this example in your browser via Binder
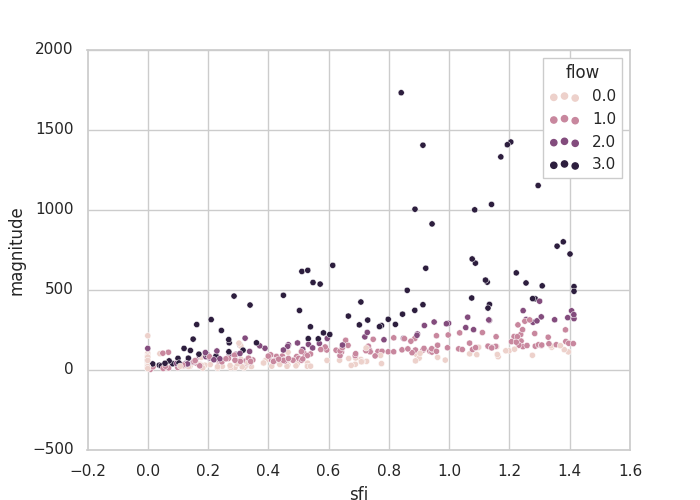
Plot scatterring features#
shows shows the relationship between two numerical features.
# Author: L.Kouadio
# Licence: BSD-3-clause
import matplotlib.pyplot as plt
plt.style.use ('classic')
from watex.datasets import fetch_data
from watex.view import ExPlot
data = fetch_data ('bagoue original').get('data=dfy1')
# we will use the naive_imputer in bi-impute mode to fix existing
# NaN
from watex.utils import naive_imputer
data = naive_imputer(data, mode ='bi-impute')
p= ExPlot(tname='flow', fig_size =(7, 5)).fit(data)
ExPlot(tname='flow', fig_size =(7, 5), sns_style = 'whitegrid').fit(data).plotscatter (
    xname ='sfi', yname='magnitude' )
<'ExPlot':xname='sfi', yname='magnitude' , tname='flow'>
Total running time of the script: ( 0 minutes 0.208 seconds)