Note
Go to the end to download the full example code or to run this example in your browser via Binder
Plot grid#
joints histogram on the edge of regression line
# Author: L.Kouadio
# Licence: BSD-3-clause
from watex.datasets import fetch_data
from watex.view import ExPlot
data = fetch_data ('bagoue original').get('data=dfy1')
# we will use the naive_imputer in bi-impute mode to fix existing
# NaN
from watex.utils import naive_imputer
data = naive_imputer(data, mode ='bi-impute')
p= ExPlot(tname='flow', fig_size =(7, 5), sns_style ='ticks').fit(data)
p.plotjoint(xname ='sfi', yname='magnitude', hue='flow',
            pkg ='sns',
            )
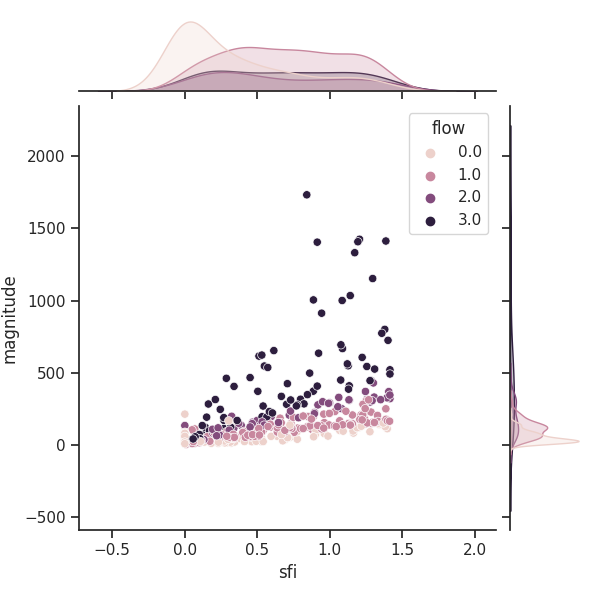
<'ExPlot':xname='sfi', yname='magnitude' , tname='flow'>
Total running time of the script: ( 0 minutes 0.458 seconds)