Note
Go to the end to download the full example code or to run this example in your browser via Binder
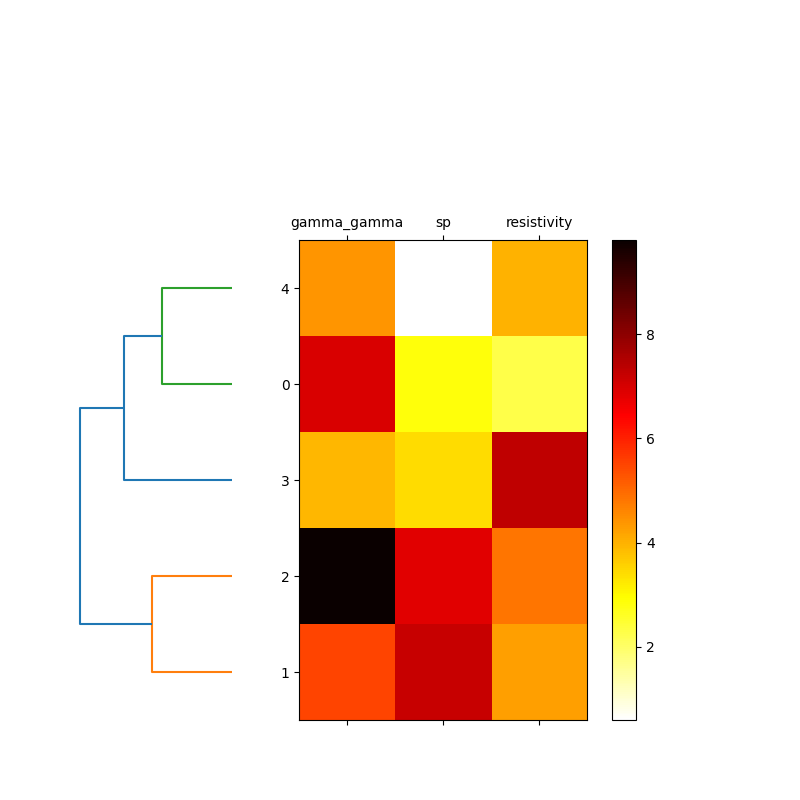
Plot dendrogram combined with heatmap#
visualizes combined dendrogram and heatmap
# Author: L.Kouadio
# Licence: BSD-3-clause
Plot using random data
import numpy as np
import pandas as pd
from watex.view.mlplot import plotDendroheat
np.random.seed(123)
variables =['gamma_gamma', 'sp', 'resistivity'] ; labels =['k_0', 'k_1', 'k_2',
                                         'k_3', 'k_4']
X= np.random.random_sample ([5,3]) *10
df =pd.DataFrame (X, columns =variables, index =labels)
plotDendroheat (df )

# (2) -> Use Bagoue data
# from watex.datasets import load_bagoue
# X, y = load_bagoue (as_frame=True )
# X =X[['magnitude', 'power', 'sfi']].astype(float) # convert to float
# plotDendroheat (X )
Total running time of the script: ( 0 minutes 0.196 seconds)