Note
Go to the end to download the full example code or to run this example in your browser via Binder
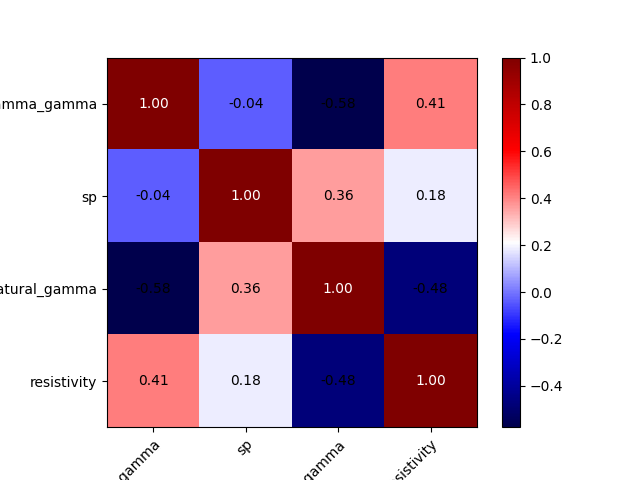
Plot ex-heatmap#
plots correlation matrix as a heat map.
# Author: L.Kouadio
# Licence: BSD-3-clause
mlxtend package needs to be install to take advantages of this plot. Use pip for installation as pip install mlxtend
from watex.datasets import load_hlogs
from watex.utils.plotutils import plot_mlxtend_heatmap
h=load_hlogs()
features = ['gamma_gamma', 'sp',
            'natural_gamma', 'resistivity']
plot_mlxtend_heatmap (h.frame , columns =features, cmap ='seismic')
(<Figure size 640x480 with 2 Axes>, <AxesSubplot:>)
Total running time of the script: ( 0 minutes 0.169 seconds)