Note
Go to the end to download the full example code or to run this example in your browser via Binder
Plot confusion matrix#
plots a confusion matrix for a single classifier model.
# Author: L.Kouadio
# Licence: BSD-3-clause
- Import the required models and fetch a an Ababoost model
for instance then plot the confusion metric
import matplotlib.pyplot as plt
plt.style.use ('classic')
from watex.datasets import fetch_data
from watex.exlib.sklearn import train_test_split
from watex.models import pModels
from watex.utils.plotutils import plot_confusion_matrix
# split the  data . Note that fetch_data output X and y
X, Xt, y, yt  = train_test_split (* fetch_data ('bagoue analysed'), test_size =.25  )
# train the model with the best estimator
pmo = pModels (model ='ada' )
pmo.fit(X, y )
print(pmo.estimator_ )
/home/docs/checkouts/readthedocs.org/user_builds/watex/envs/0.2.3/lib/python3.10/site-packages/sklearn/ensemble/_base.py:166: FutureWarning:

`base_estimator` was renamed to `estimator` in version 1.2 and will be removed in 1.4.

AdaBoostClassifier(base_estimator=DecisionTreeClassifier(criterion='entropy',
                                                         max_depth=7),
                   learning_rate=0.06)
Predict the score using under the hood the best estimator for adaboost classifier
ypred = pmo.predict(Xt)

# now plot the score
plot_confusion_matrix (yt , ypred )
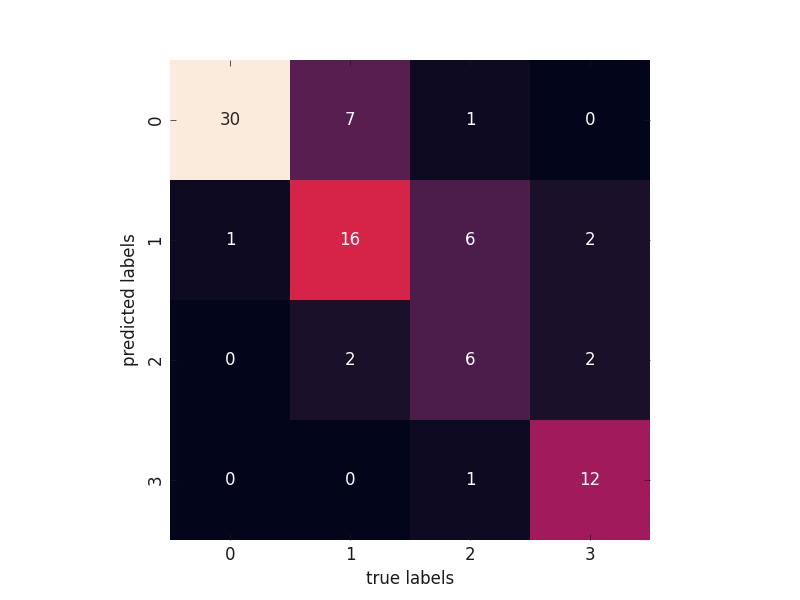
array([[30,  1,  0,  0],
       [ 7, 16,  2,  0],
       [ 1,  6,  6,  1],
       [ 0,  2,  2, 12]])
Total running time of the script: ( 0 minutes 0.301 seconds)