Note
Go to the end to download the full example code or to run this example in your browser via Binder
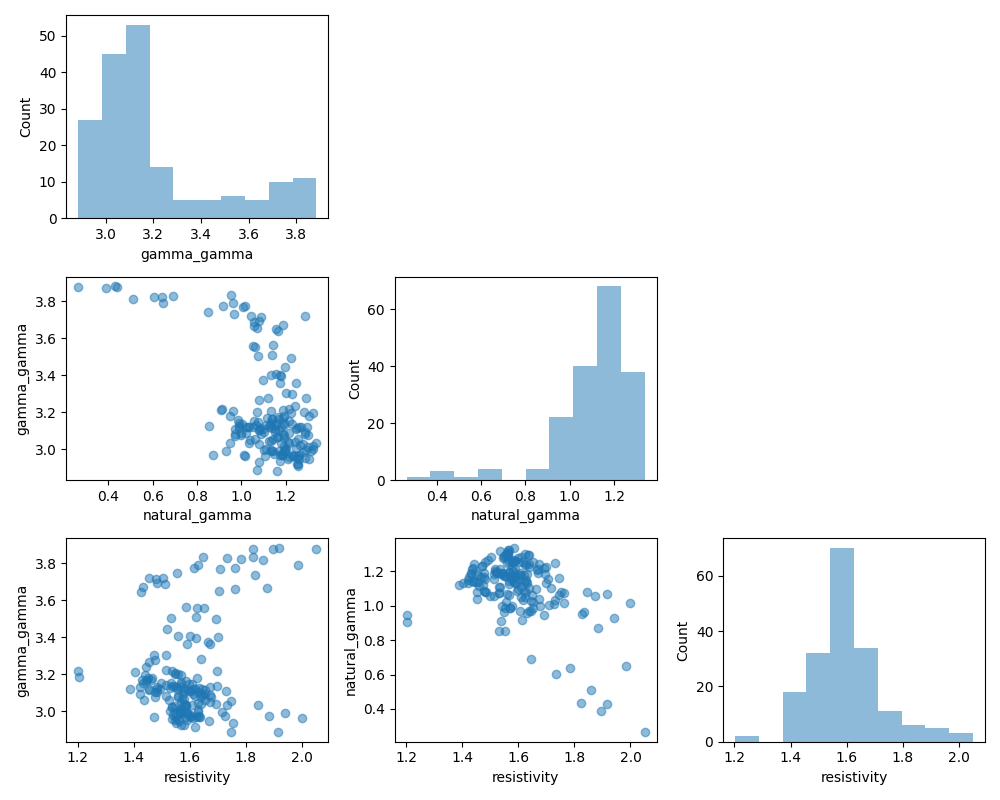
Plot ex-matrix#
visualizes the features correlation as a matrix array.
# Author: L.Kouadio
# Licence: BSD-3-clause
mlxtend package needs to be install to take advantages of this plot. Use pip for installation as pip install mlxtend
from watex.datasets import load_hlogs
from watex.utils.plotutils import plot_mlxtend_matrix
import pandas as pd
import numpy as np
h=load_hlogs()
features = ['gamma_gamma', 'natural_gamma', 'resistivity']
data = pd.DataFrame ( np.log10 (h.frame[features]), columns =features )
plot_mlxtend_matrix (data, columns =features)
(<Figure size 1000x800 with 9 Axes>, array([[<AxesSubplot:xlabel='gamma_gamma', ylabel='Count'>,
        <AxesSubplot:>, <AxesSubplot:>],
       [<AxesSubplot:xlabel='natural_gamma', ylabel='gamma_gamma'>,
        <AxesSubplot:xlabel='natural_gamma', ylabel='Count'>,
        <AxesSubplot:>],
       [<AxesSubplot:xlabel='resistivity', ylabel='gamma_gamma'>,
        <AxesSubplot:xlabel='resistivity', ylabel='natural_gamma'>,
        <AxesSubplot:xlabel='resistivity', ylabel='Count'>]], dtype=object))
Total running time of the script: ( 0 minutes 0.513 seconds)