Note
Go to the end to download the full example code or to run this example in your browser via Binder
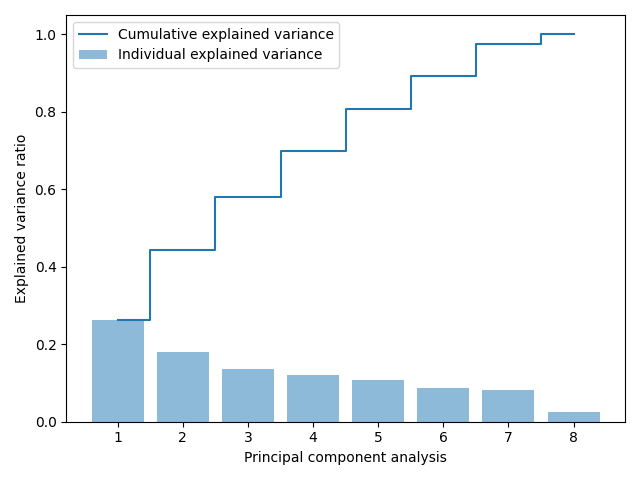
Explained variance ratio#
visualizes the explained variance ratio using the test data looking at the steps behind the PCA
# Author: L.Kouadio
# Licence: BSD-3-clause
Call the test data: Bagoue datasets#
The first raw dataset is selected using data=dfy1 passed to the get method
see more in BagoueNotes.
import matplotlib.pyplot as plt
from watex.exlib.sklearn import SimpleImputer
from watex.utils import selectfeatures
from watex.datasets import fetch_data
data= fetch_data("bagoue original").get('data=dfy1') # encoded flow categories
y = data.flow ; X= data.drop(columns='flow')
# select the numerical features
X =selectfeatures(X, include ='number')
# imputed the missing data
X = SimpleImputer().fit_transform(X)
Total variance ratio#
from watex.analysis import total_variance_ratio
 # Use the X value in the example of `extract_pca` function
total_variance_ratio(X, view=True)

plt.show()
Total running time of the script: ( 0 minutes 0.175 seconds)