Note
Go to the end to download the full example code or to run this example in your browser via Binder
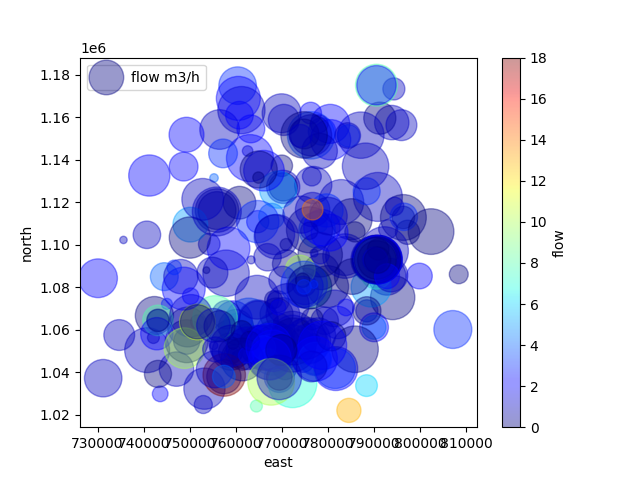
Plot target inspection#
indicates the distribution of the data based on the coordinates positions.
# Author: L.Kouadio
# Licence: BSD-3-clause
import matplotlib.pyplot as plt
from watex.transformers import StratifiedWithCategoryAdder
from watex.view.plot import QuickPlot
from watex.datasets import load_bagoue
df = load_bagoue ().frame
stratifiedNumObj= StratifiedWithCategoryAdder('flow')
strat_train_set , *_= \
        stratifiedNumObj.fit_transform(X=df)
pd_kws ={'alpha': 0.4,
             'label': 'flow m3/h',
             'c':'flow',
            'cmap':plt.get_cmap('jet'),
             'colorbar':True}
qkObj=QuickPlot(fs=25., fig_size = (7, 5))
qkObj.fit(strat_train_set)
qkObj.naiveviz( x= 'east', y='north', **pd_kws)
QuickPlot(savefig= None, fig_num= 1, fig_size= (7, 5), ... , classes= None, tname= None, mapflow= False)
Total running time of the script: ( 0 minutes 0.283 seconds)