Note
Go to the end to download the full example code or to run this example in your browser via Binder
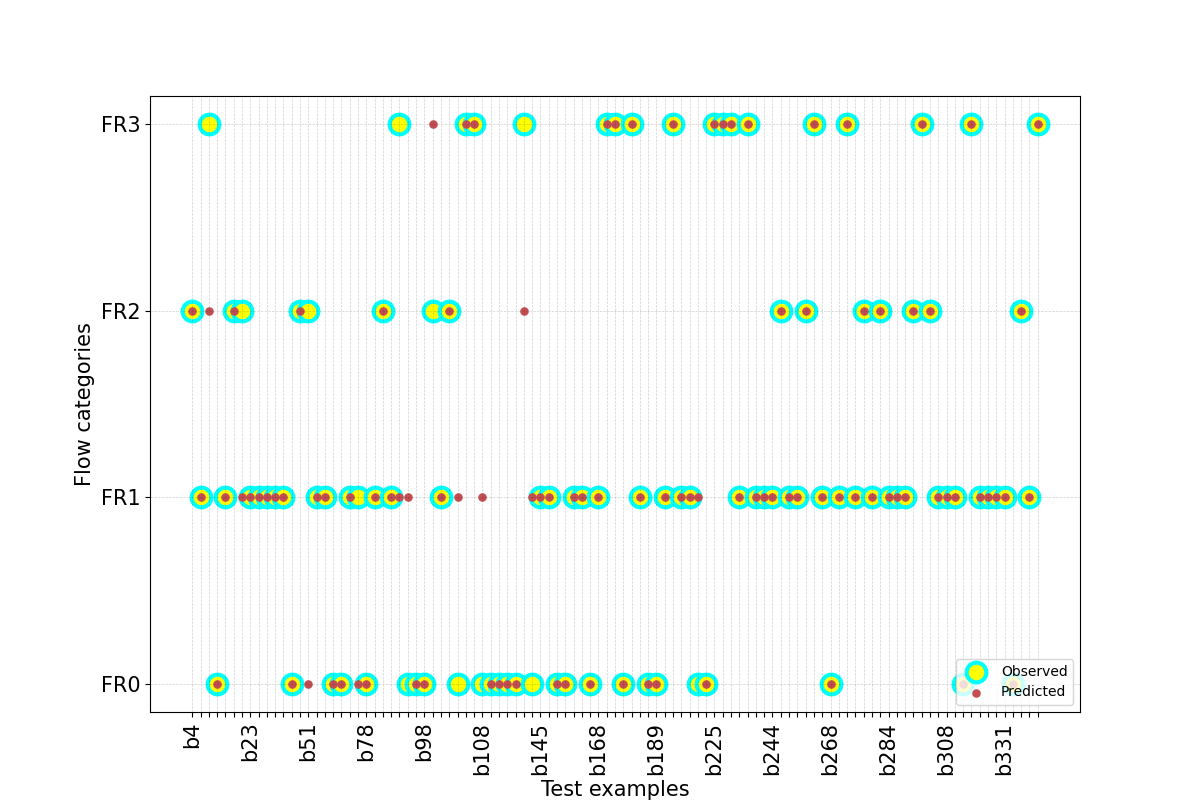
Plot model#
plots model results ‘y’ (true labels) versus ‘ypred’ (predicted) from test data.
# Author: L.Kouadio
# Licence: BSD-3-clause
The plots is a great alternative to know where estimator/classifier fails to predict correctly the target. * Prepare our data - Use analysis data of Bagoue dataset since data is alread scaled and imputed
from watex.exlib.sklearn  import SVC
from watex.datasets import fetch_data
from watex.utils.mlutils import split_train_test_by_id
from watex.view import plotModel
X, y = fetch_data('bagoue analysis' )
_, Xtest = split_train_test_by_id(X,
                          test_ratio=.3 ,  # 30% in test set
                          keep_colindex= False
                        )
_, ytest = split_train_test_by_id(y, .3 , keep_colindex =False)

# * prepared our demo estimator and plot model predicted

svc_clf = SVC(C=100, gamma=1e-2, kernel='rbf', random_state =42)
base_plot_params ={
             'lw' :3.,                  # line width
             'lc':(.9, 0, .8),
             'ms':7.,
             'yp_marker' :'o',
             'fig_size':(12, 8),
             'font_size':15.,
             'xlabel': 'Test examples',
             'ylabel':'Flow categories' ,
             'marker':'o',
             'markeredgecolor':'k',
             'markerfacecolor':'b',
             'markeredgewidth':3,
             'yp_markerfacecolor' :'k',
             'yp_markeredgecolor':'r',
             'alpha' :1.,
             'yp_markeredgewidth':2.,
             'show_grid' :True,
             'galpha' :0.2,
             'glw':.5,
             'rotate_xlabel' :90.,
             'fs' :3.,
             's' :20 ,
             'rotate_xlabel':90
        }
plotModel(yt= ytest ,
        Xt=Xtest ,
        predict =True , # predict the result (estimator fit)
        clf=svc_clf ,
        fill_between= False,
        prefix ='b',
        labels=['FR0', 'FR1', 'FR2', 'FR3'], # replace 'y' labels.
        **base_plot_params
                   )
# plot shows where the model failed to predict the target 'yt'
/home/docs/checkouts/readthedocs.org/user_builds/watex/envs/0.2.1/lib/python3.10/site-packages/sklearn/utils/validation.py:1143: DataConversionWarning:

A column-vector y was passed when a 1d array was expected. Please change the shape of y to (n_samples, ), for example using ravel().
Total running time of the script: ( 0 minutes 0.302 seconds)