Note
Go to the end to download the full example code or to run this example in your browser via Binder
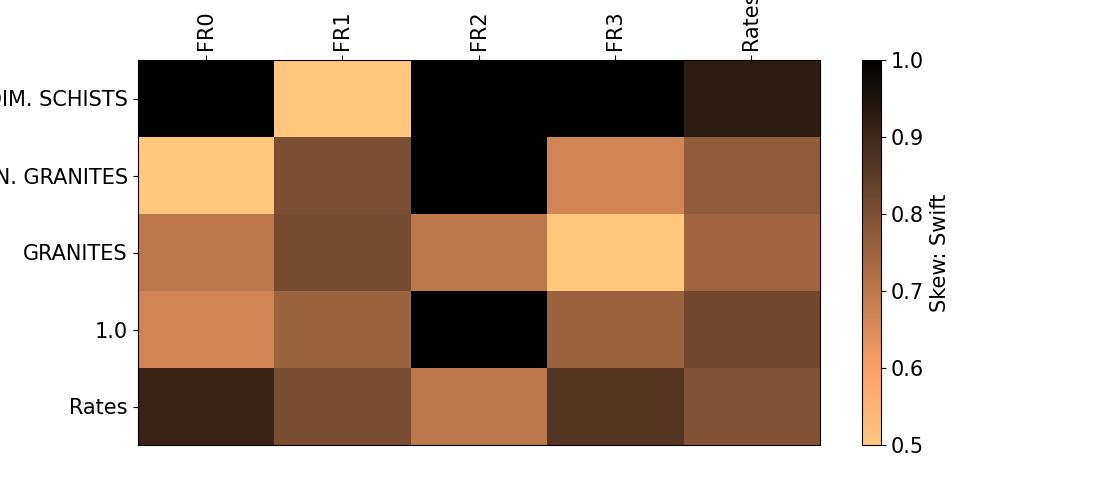
Plot matrix show#
visualizes basically the matrix show
# Author: L.Kouadio
# Licence: BSD-3-clause
import numpy as np
from watex.view.mlplot import plot_matshow
matshow_kwargs ={
    'aspect': 'auto',
    'interpolation': None,
   'cmap':'copper_r',
        }
baseplot_kws ={'lw':3,
           'lc':(.9, 0, .8),
           'font_size':15.,
            'cb_format':None,
            #'cb_label':'Rate of prediction',
            'xlabel': 'Predicted flow classes',
            'ylabel': 'Geological rocks',
            'font_weight':None,
            'tp_labelbottom':False,
            'tp_labeltop':True,
            'tp_bottom': False
            }
labelx =['FR0', 'FR1', 'FR2', 'FR3', 'Rates']
labely =['VOLCANO-SEDIM. SCHISTS', 'GEOSYN. GRANITES',
             'GRANITES', '1.0', 'Rates']
array2d = np.array([(1. , .5, 1. ,1., .9286),
                    (.5,  .8, 1., .667, .7692),
                    (.7, .81, .7, .5, .7442),
                    (.667, .75, 1., .75, .82),
                    (.9091, 0.8064, .7, .8667, .7931)]
                   )
plot_matshow(array2d,
              labelx,
              labely,
             matshow_kwargs,
             **baseplot_kws
             )
Total running time of the script: ( 0 minutes 0.227 seconds)