Note
Go to the end to download the full example code or to run this example in your browser via Binder
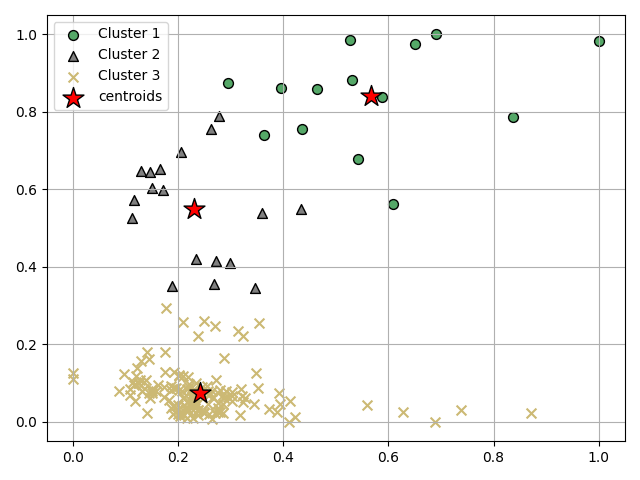
Plot clusters#
visualizes the cluster that k-means identified in the dataset
# Author: L.Kouadio
# Licence: BSD-3-clause
from watex.exlib.sklearn import KMeans, MinMaxScaler
from watex.utils.plotutils import plot_clusters
from watex.datasets import fetch_data
h= fetch_data('hlogs').frame
# collect two features 'resistivity' and gamma-gamma logging values
h2 = h[['resistivity', 'gamma_gamma']]
km = KMeans (n_clusters =3 , init= 'random' )
# scaled the data with MinMax scaler i.e. between ( 0-1)
h2_scaled = MinMaxScaler().fit_transform(h2)
ykm = km.fit_predict(h2_scaled )
plot_clusters (3 , h2_scaled, ykm , km.cluster_centers_ )
/home/docs/checkouts/readthedocs.org/user_builds/watex/envs/0.2.1/lib/python3.10/site-packages/sklearn/cluster/_kmeans.py:870: FutureWarning:

The default value of `n_init` will change from 10 to 'auto' in 1.4. Set the value of `n_init` explicitly to suppress the warning
Total running time of the script: ( 0 minutes 0.212 seconds)