Note
Go to the end to download the full example code or to run this example in your browser via Binder
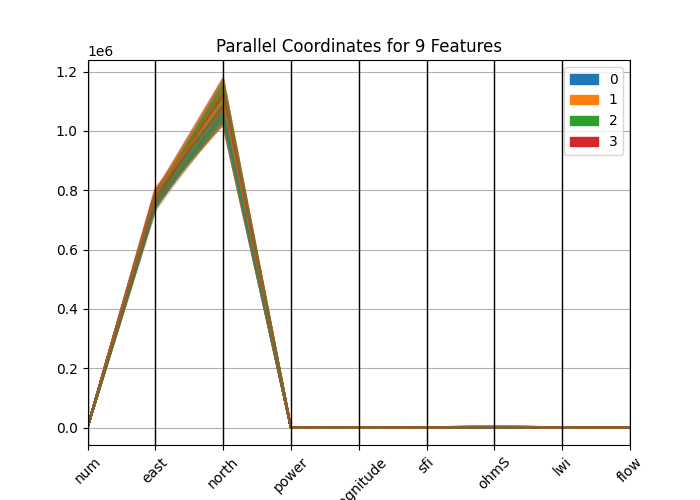
Plot parallel coordinates#
visualizes the features parallel coordinates
# Author: L.Kouadio
# Licence: BSD-3-clause
from watex.datasets import fetch_data
from watex.view import ExPlot
data =fetch_data('original data').get('data=dfy1')
p = ExPlot (tname ='flow', fig_size =(7, 5)).fit(data)
# need yellowbrick to be installed if pkg=yb orherwise used pd instead
p.plotparallelcoords(pkg='yb')
<'ExPlot':xname=None, yname=None , tname='flow'>
Total running time of the script: ( 0 minutes 0.484 seconds)