Note
Go to the end to download the full example code or to run this example in your browser via Binder
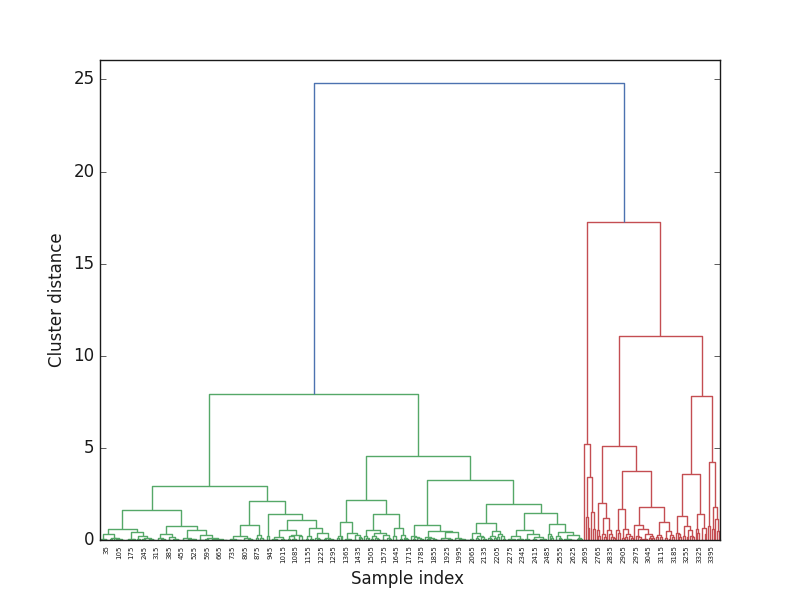
Plot naive dendrogram#
visualizes a rapid dendrogram using the ward clustering function from Scipy.
# Author: L.Kouadio
# Licence: BSD-3-clause
import matplotlib.pyplot as plt
plt.style.use ("classic")
from watex.datasets import fetch_data
from watex.utils.plotutils import plot_naive_dendrogram
X, _= fetch_data('Bagoue analysed') # data is already scaled
# get the two features 'power' and  'magnitude'
data = X[['power', 'magnitude']]
plot_naive_dendrogram(data )
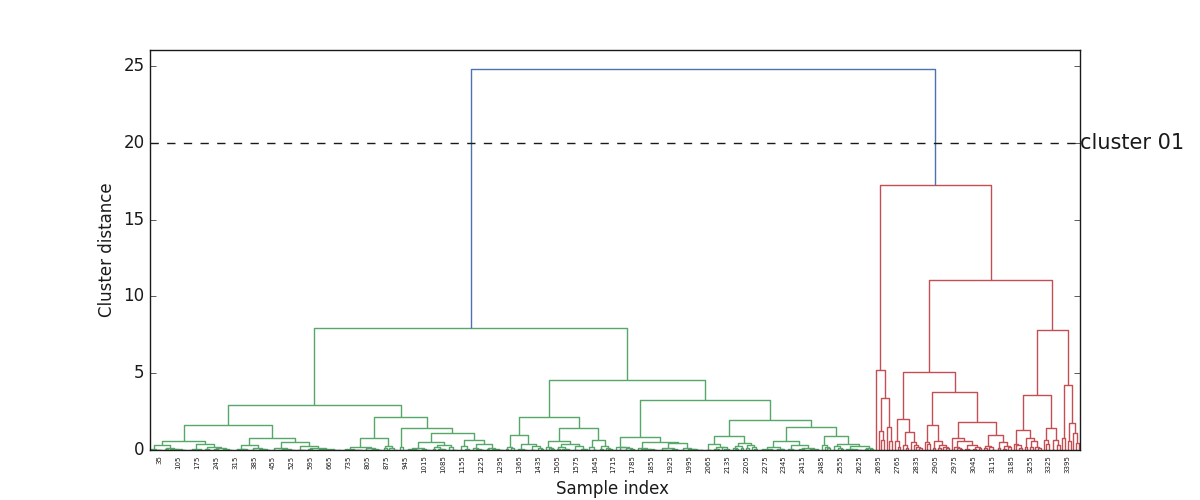
Add the horizontal line of the cluster at ybounds = (20 , 20 ) for a single cluster (cluser 1)
plot_naive_dendrogram(data , 20, 20 )
Total running time of the script: ( 0 minutes 0.969 seconds)